Fig. 5
Download original image
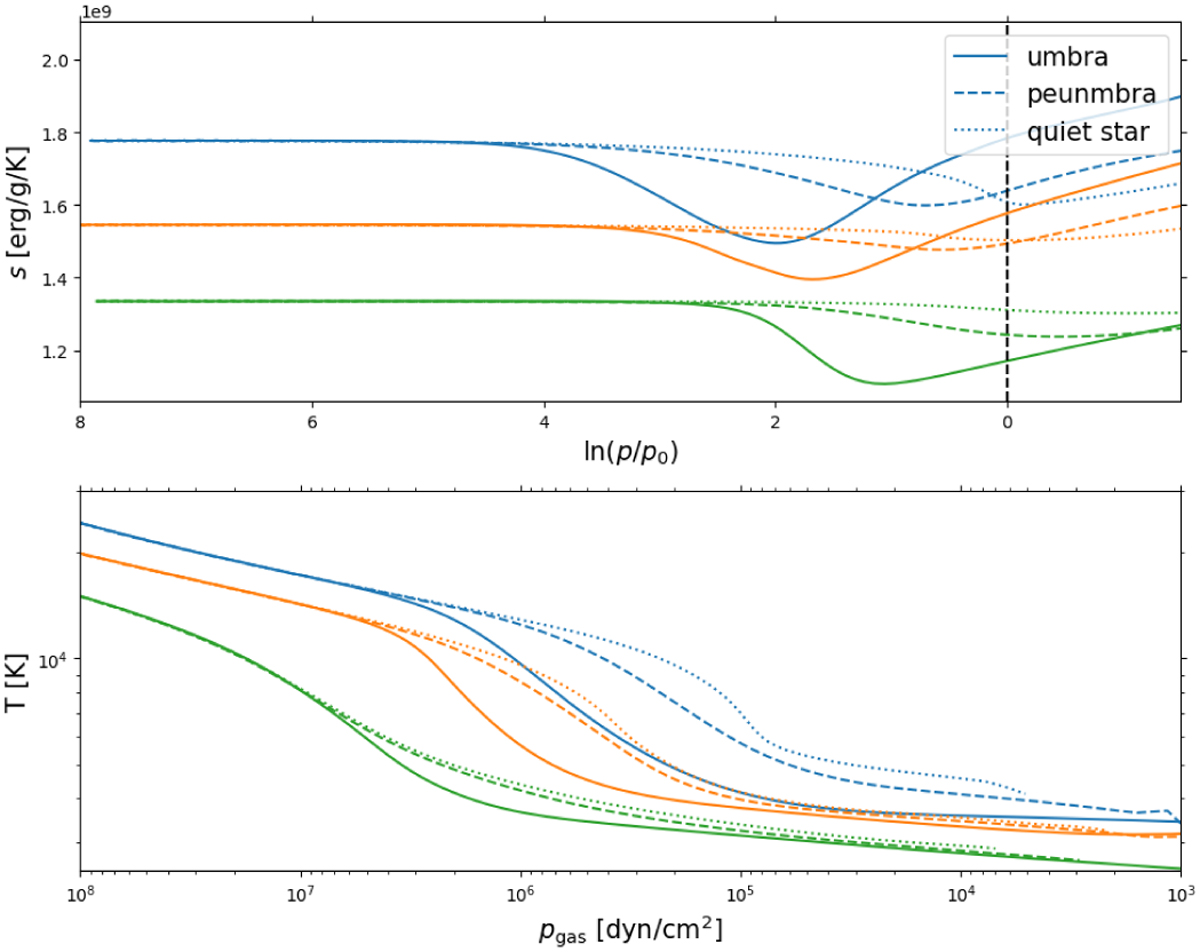
Thermodynamic structure of the starspots. Top: Average entropy in the umbral (solid), penumbral (dashed) and quiet star (dotted) region plotted against pressure in units of the pressure scale height ln(p/p0) calculated from the pressure stratification in the quiet star region. Bottom: Temperature stratification for all the cases plotted against the gas pressure in logscale. The dashed vertical line represents the stellar surface. The bottom boundary is located towards the left side of the plot. The colors refer to the same stellar types as in Fig. 1.
Current usage metrics show cumulative count of Article Views (full-text article views including HTML views, PDF and ePub downloads, according to the available data) and Abstracts Views on Vision4Press platform.
Data correspond to usage on the plateform after 2015. The current usage metrics is available 48-96 hours after online publication and is updated daily on week days.
Initial download of the metrics may take a while.