Open Access
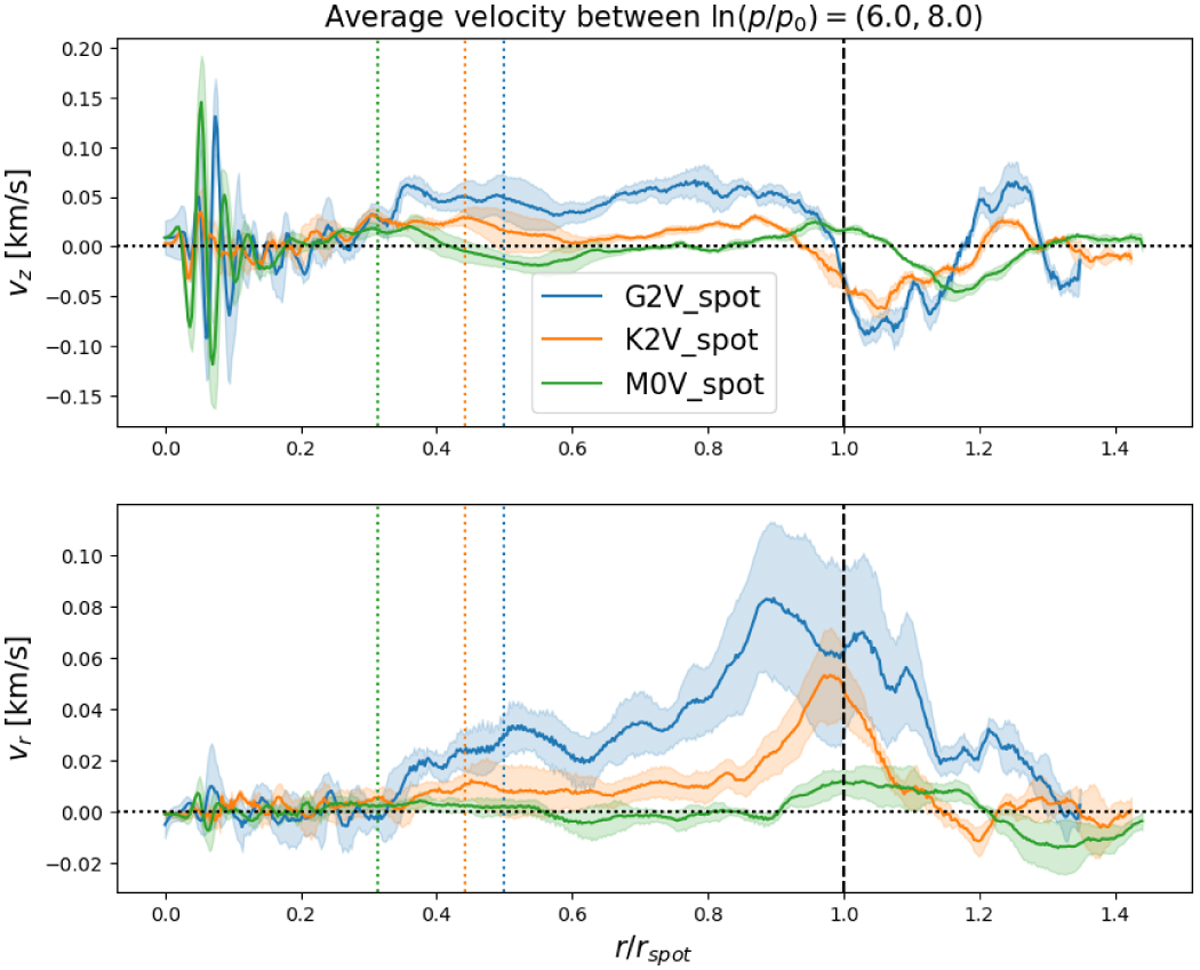
Fig. 4
Download original image
Vertical velocity vz (top) and radial velocity (bottom) averaged between ln p/p0 = 6 and 8. The error bars indicate the 1σ standard deviation in the averaging, from the data in Fig. 2. The horizontal axis and the dashed and dotted lines are the same as in the previous figures.
Current usage metrics show cumulative count of Article Views (full-text article views including HTML views, PDF and ePub downloads, according to the available data) and Abstracts Views on Vision4Press platform.
Data correspond to usage on the plateform after 2015. The current usage metrics is available 48-96 hours after online publication and is updated daily on week days.
Initial download of the metrics may take a while.