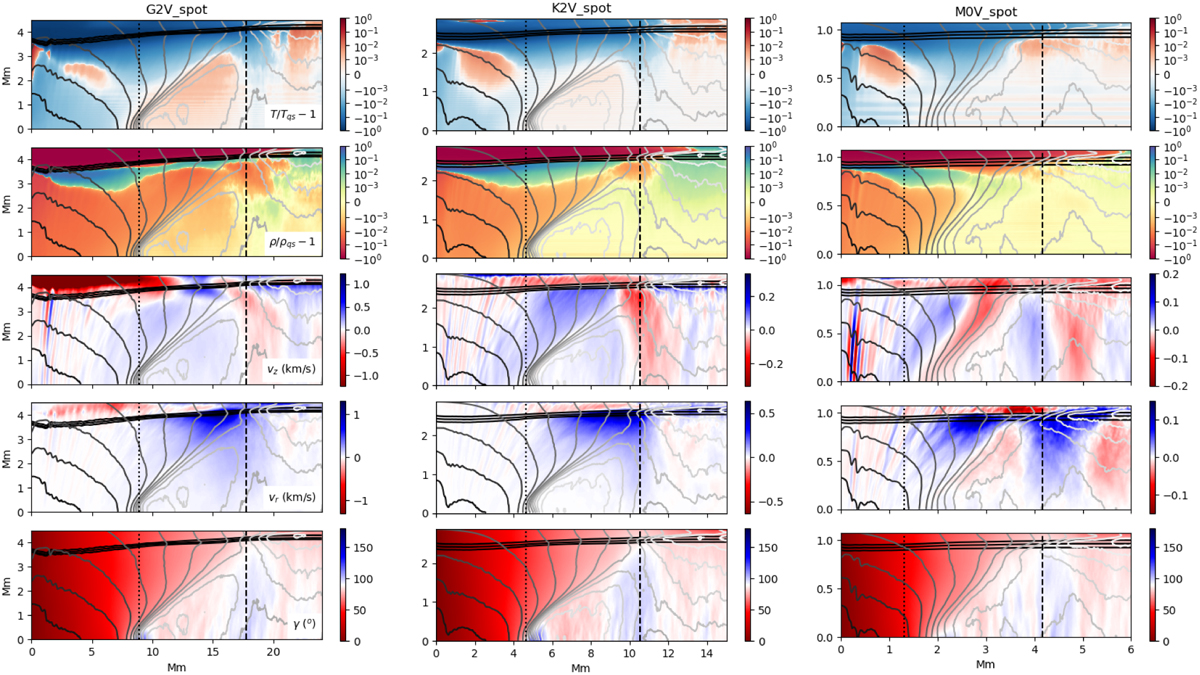
Fig. 2
Download original image
Time averages of an azimuthally averaged relative change in temperature T/Tqs − 1 (first row), relative change in density ρ/ρqs − 1 (second row), vertical velocity (third row), radial velocity (fourth row), and magnetic field inclination (fifth row) for the G2V (first column, K2V (second column), and M0V (third column) starspot. The spot center corresponds to zero on the horizontal axis. The black contour lines near the top boundary represent the log10 τ = −1, 0, 1 levels (from top to bottom), respectively. The gray contour lines represent regions of similar magnetic field strength ranging from log10(B/Bmax = −2 to 0 in 15 levels, where Bmax = 14.88, 19.46, and 20.13 kG for the G2V, K2V, and M0V starspot, respectively. The colormaps of the first two plots are displayed as symmetric log, to represent the large variation that can exist in temperature and density inside and outside of a starspot. To showcase this variation better, the vertical scale is expanded relative to the horizontal scale.
Current usage metrics show cumulative count of Article Views (full-text article views including HTML views, PDF and ePub downloads, according to the available data) and Abstracts Views on Vision4Press platform.
Data correspond to usage on the plateform after 2015. The current usage metrics is available 48-96 hours after online publication and is updated daily on week days.
Initial download of the metrics may take a while.