Fig. 4
Download original image
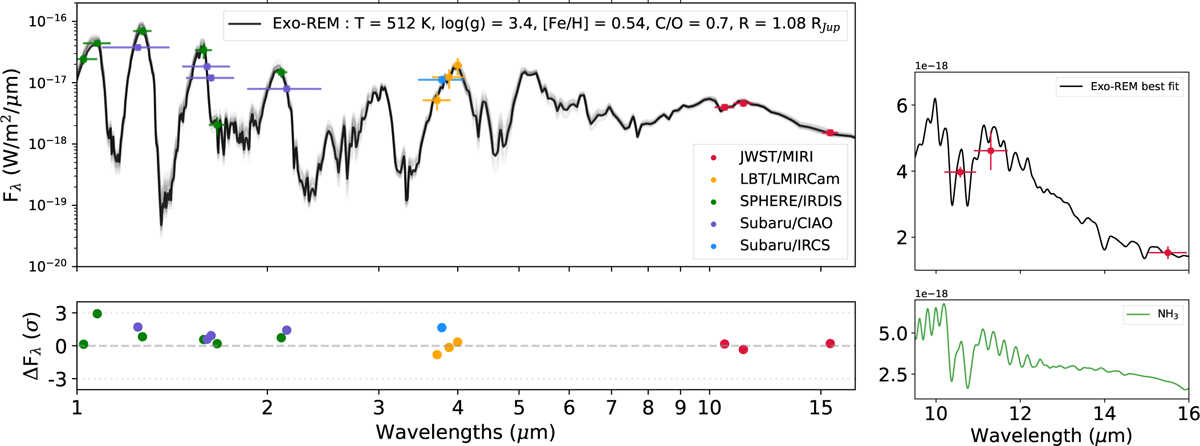
Exo-REM best-fit model (black curve) and the lighter black models come from the posterior distribution from the best fit. The points represent the photometric values from VLT/SPHERE (green), Suburu/HiCIAO (purple), LBTI/LMIRcam (orange), and Subaru/ICRS (blue). The MIRI photometry is shown in red. Photometric points are plotted at the filter’s central wavelength, with the width indicated. The bottom plot represent the residuals between the photometric points and the best fits models: all point agree within a 3 σ precision. Right: zoom on the MIRI data and the NH3 absorption, fluxes values are displayed with a linear scale.
Current usage metrics show cumulative count of Article Views (full-text article views including HTML views, PDF and ePub downloads, according to the available data) and Abstracts Views on Vision4Press platform.
Data correspond to usage on the plateform after 2015. The current usage metrics is available 48-96 hours after online publication and is updated daily on week days.
Initial download of the metrics may take a while.