Fig. A.2.
Download original image
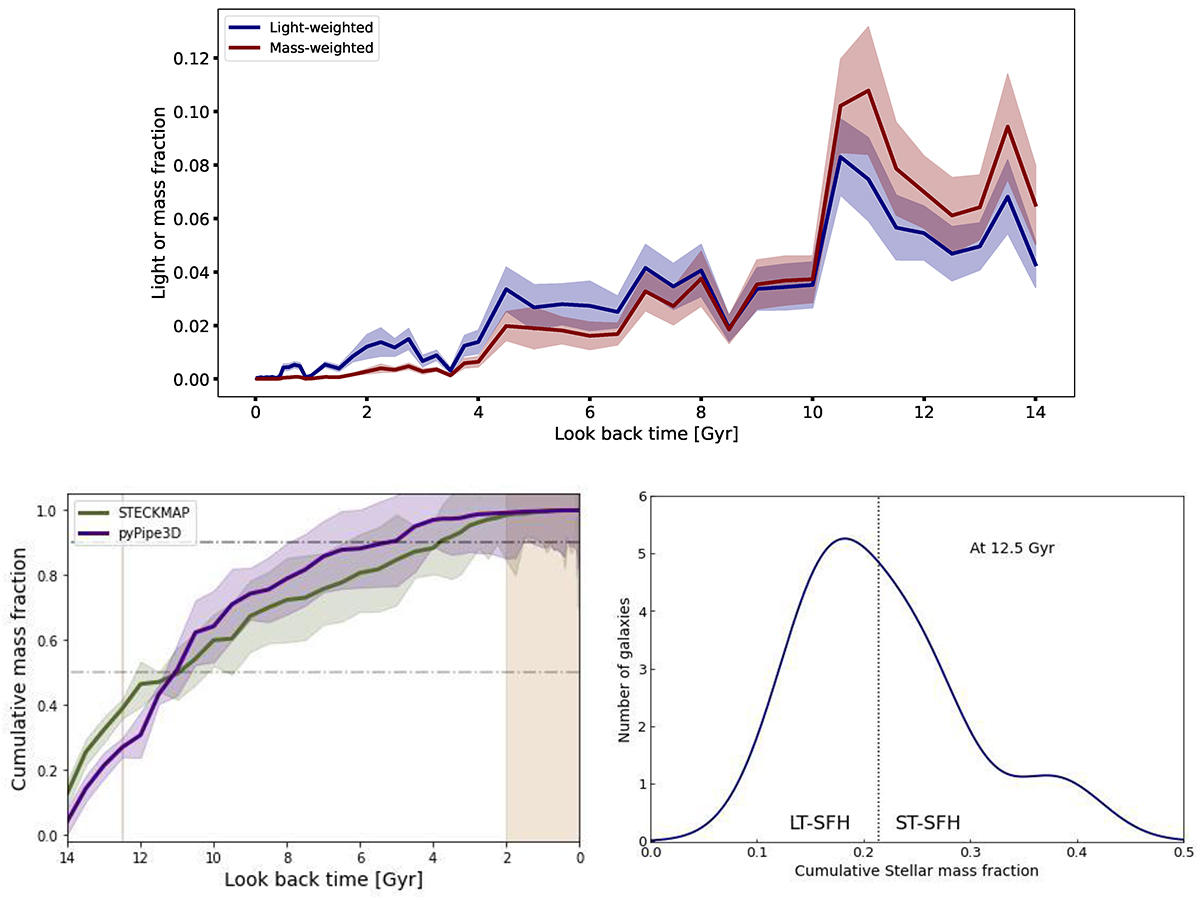
Stellar light and mass fractions formed at different look back times (blue and red profiles, respectively). Upper panel: Average of over 50 profiles constructed from MC iterations using the pyPipe3D full spectral fitting routine, represented by each solid line. The shaded areas around the solid lines are the standard deviation of derived profiles. Lower left: Example comparison of the CMFs derived for a single galaxy using the pyPipe3D and STECKMAP full spectral fitting routines is presented in purple and green, respectively. Lower right: Smoothed distribution of the cumulative star formation histories at 12.5 Gyr. The vertical dashed line marks the 21.4% of total stellar mass.
Current usage metrics show cumulative count of Article Views (full-text article views including HTML views, PDF and ePub downloads, according to the available data) and Abstracts Views on Vision4Press platform.
Data correspond to usage on the plateform after 2015. The current usage metrics is available 48-96 hours after online publication and is updated daily on week days.
Initial download of the metrics may take a while.