Open Access
Fig. A.1.
Download original image
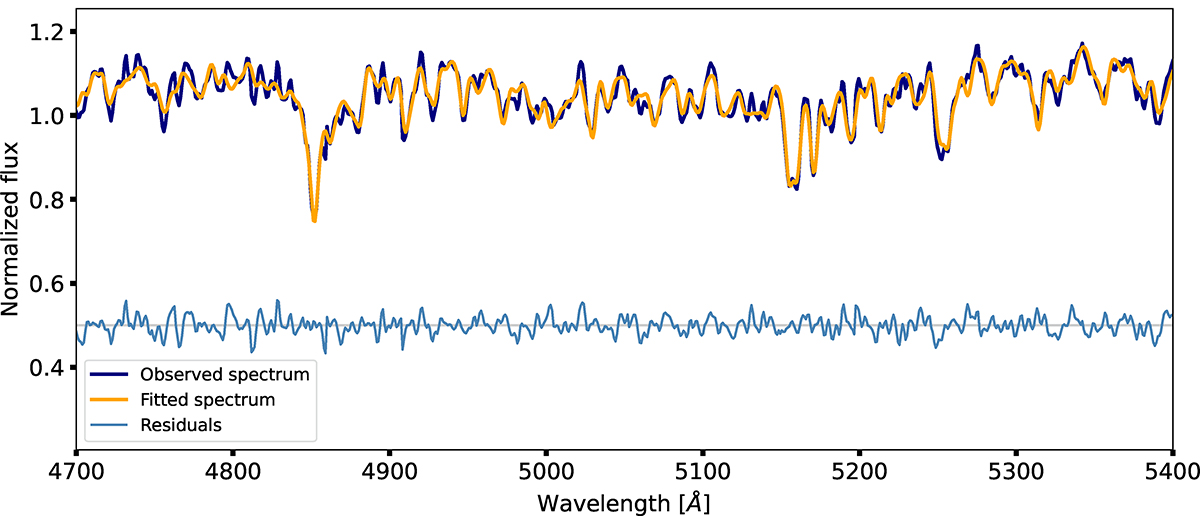
Observed spectrum (plotted in dark blue) corrected for emission line residuals and normalized. The pyPipe3d best-fitting synthetic spectrum is shown in orange, and the residuals of the fit are shown in light blue. For better legibility, the residuals are shifted up by 0.5.
Current usage metrics show cumulative count of Article Views (full-text article views including HTML views, PDF and ePub downloads, according to the available data) and Abstracts Views on Vision4Press platform.
Data correspond to usage on the plateform after 2015. The current usage metrics is available 48-96 hours after online publication and is updated daily on week days.
Initial download of the metrics may take a while.