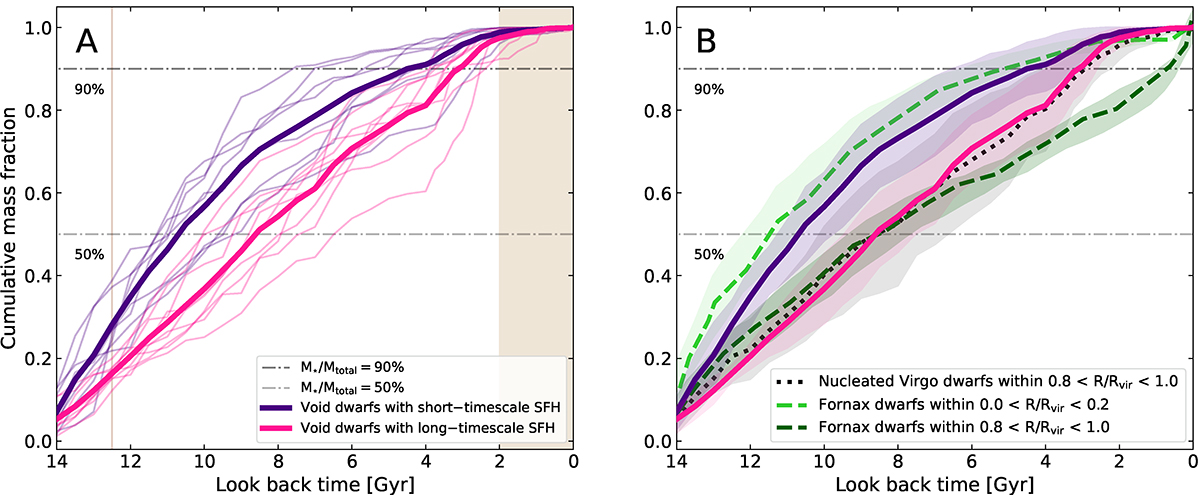
Fig. 1.
Download original image
Mass assembly history of dwarf galaxies as a function of look back time. Horizontal dashed lines from bottom to top in all panels represent the 50% and 90% cumulative stellar mass fractions, respectively. Panel A: Last 2 Gyr, is highlighted as the brown shaded area. The vertical solid line in this panel marks the τ21.4 = 12.5 Gyr, which is the criteria we adopted to classify galaxies into short- and long-timescale star formation histories, based on Domínguez-Gómez et al. (2023). Eight dwarfs have formed more than 21.4% of their present-day stellar mass by 12.5 Gyr ago (i.e., τ21.4 ≥ 12.5 Gyr, shown in purple), and nine have τ21.4 < 12.5 Gyr (shown in pink). The profiles of all dwarfs are shown with narrow lines, color-coded accordingly, and an average of each sub-sample is shown with the solid thick lines. Panel B: Average profiles of isolated and quenched dwarf galaxies (in purple and pink, as in panel A), along with their range of error (shaded area) are compared with the average profiles of their counterparts in the core and outskirts of the Fornax cluster (in light and dark green, respectively; taken from Romero-Gómez et al. 2024). Virgo dwarf galaxies hosting an NSC located at large cluster-centric distances (whose average CMFs are shown as dotted black line) exhibit a mass assembly history akin to isolated dwarf galaxies with τ21.4 < 12.5 Gyr.
Current usage metrics show cumulative count of Article Views (full-text article views including HTML views, PDF and ePub downloads, according to the available data) and Abstracts Views on Vision4Press platform.
Data correspond to usage on the plateform after 2015. The current usage metrics is available 48-96 hours after online publication and is updated daily on week days.
Initial download of the metrics may take a while.