Open Access
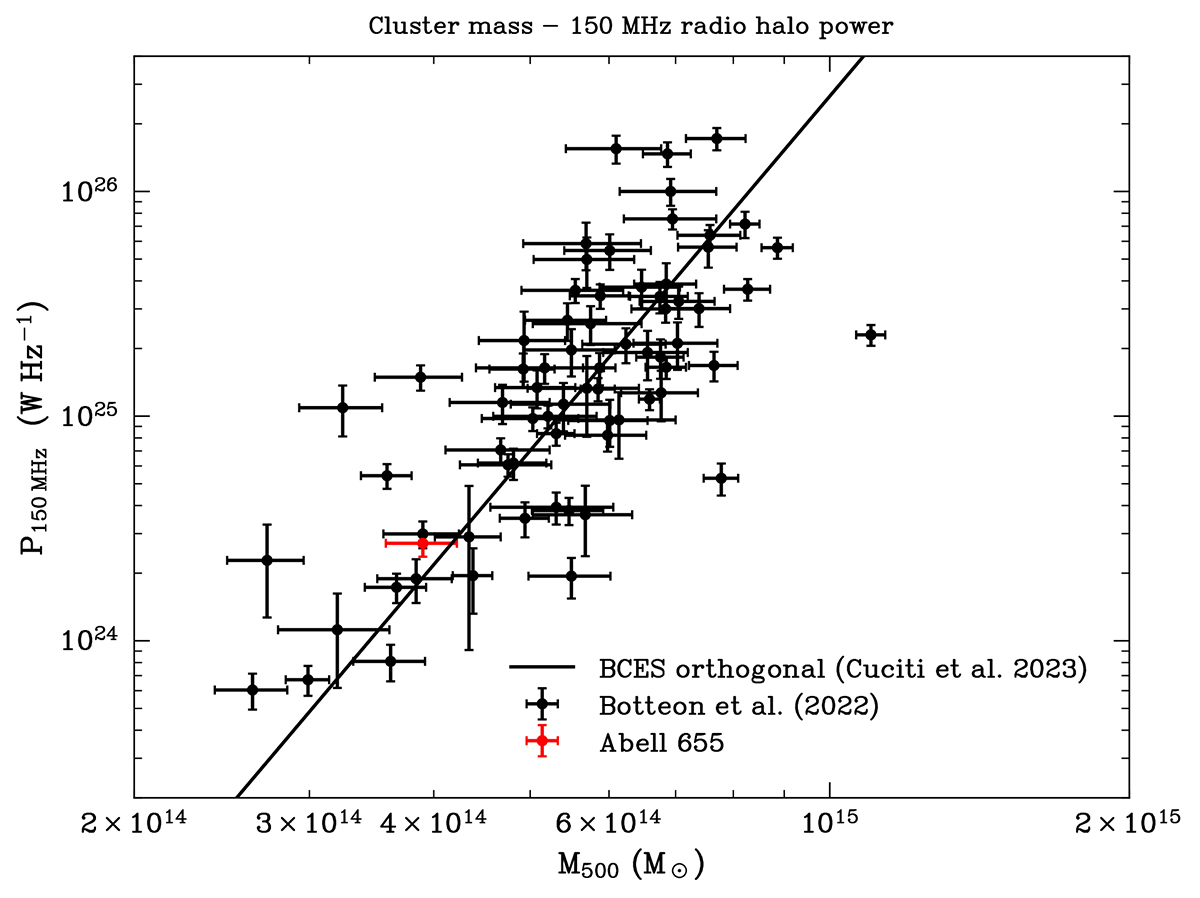
Fig. 7.
Download original image
Power–mass plot of radio halos. Black points are taken from Botteon et al. (2022a), and the solid line represents the BCES fit from Cassano et al. (2023). The red point is Abell 655, and the halo power was obtained from Botteon et al. (2022a).
Current usage metrics show cumulative count of Article Views (full-text article views including HTML views, PDF and ePub downloads, according to the available data) and Abstracts Views on Vision4Press platform.
Data correspond to usage on the plateform after 2015. The current usage metrics is available 48-96 hours after online publication and is updated daily on week days.
Initial download of the metrics may take a while.