Fig. 5.
Download original image
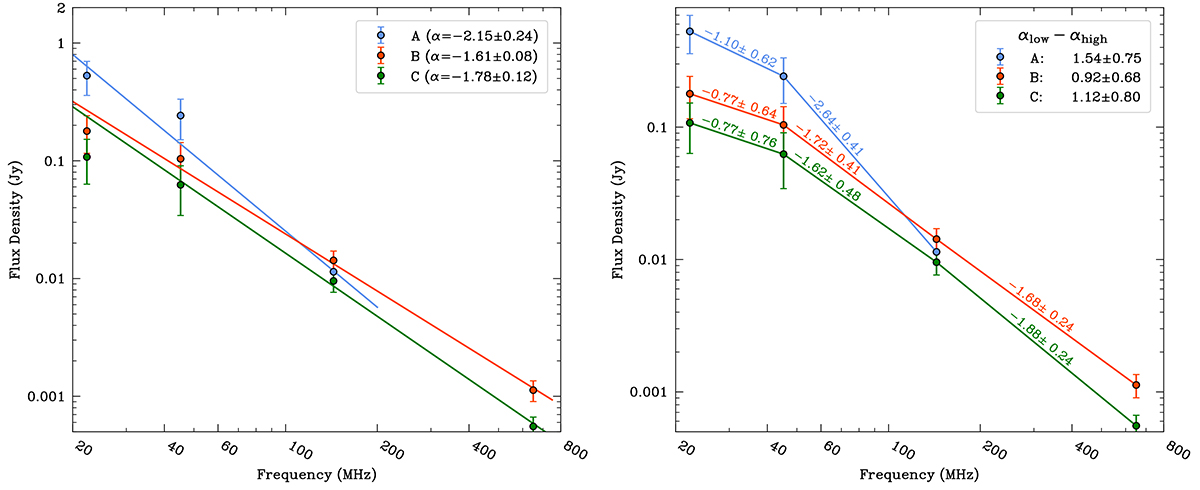
Spectral energy distribution of three regions, showing that only region A has significant (> 2σ) curvature. Labels in the plot correspond to the regions labelled in Fig. 4. Left: lines are a least-squares polynomial fit through the data in order to give an indication of the steepness of the spectra. The spectra indicate that region A is the steepest. Right: piecewise spectral indices of the three regions, including error. In the top-right corner, the difference between the spectral index at the highest frequency and the spectral index at the lowest frequency is given.
Current usage metrics show cumulative count of Article Views (full-text article views including HTML views, PDF and ePub downloads, according to the available data) and Abstracts Views on Vision4Press platform.
Data correspond to usage on the plateform after 2015. The current usage metrics is available 48-96 hours after online publication and is updated daily on week days.
Initial download of the metrics may take a while.