Fig. 4.
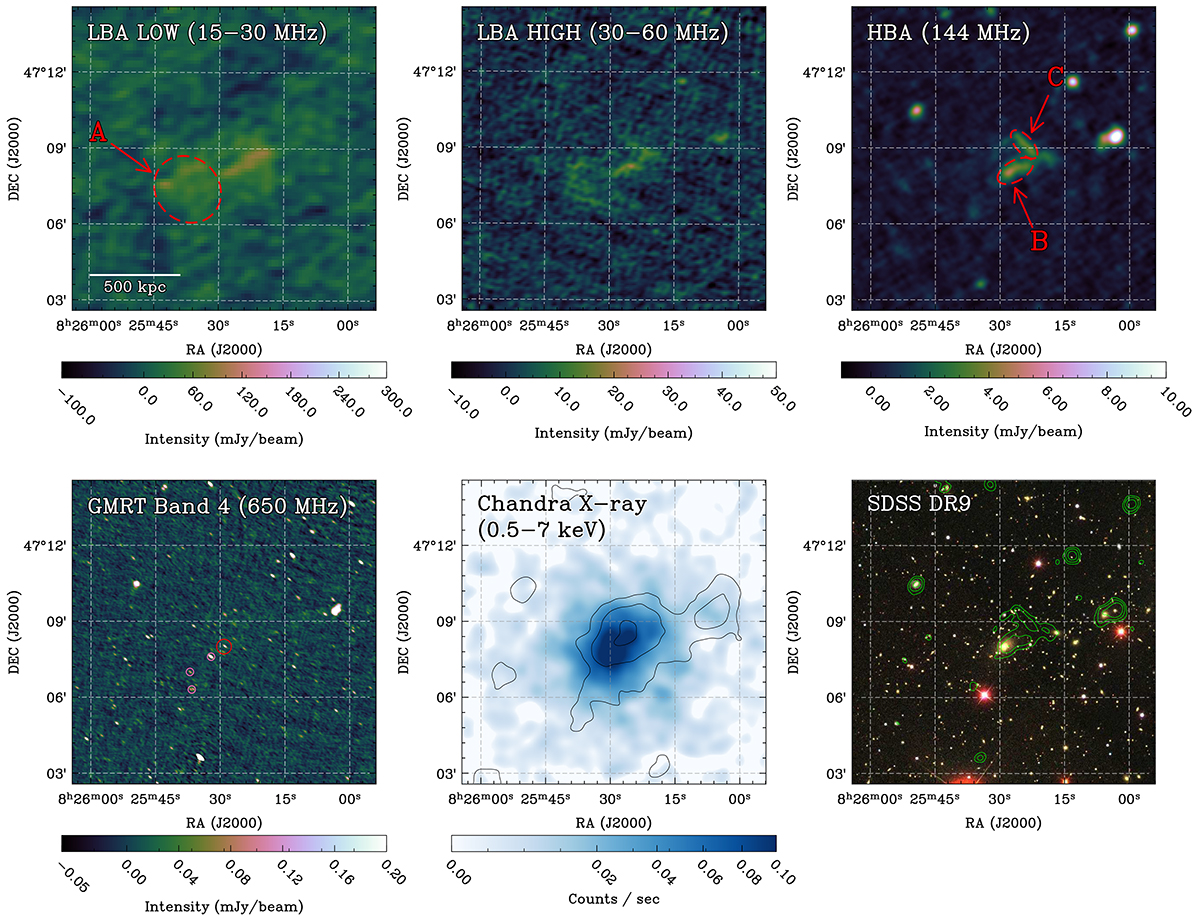
Download original image
Images of Abell 655. Top left: LOFAR LBA (15-30 MHz) image. Top centre: LOFAR LBA (30–60 MHz). Top right: LOFAR HBA (120–167 MHz), tapered to 25 kpc (rest frame of the cluster). Bottom left: GMRT band 4 (450–850 MHz), tapered to 12 arcseconds. The BCG of Abell 655 is marked with a red circle. The small pink circles indicate AGN that were subtracted from the integrated flux density of region A. Bottom centre: Chandra X-Ray (ObsID 15159; 7.97 ks integration time; 0.5–7 keV, Botteon et al. 2022a) with GMRT 650 MHz overlay (compact sources subtracted). Contours are at [1, 2, 4, 8]×σRMS, with σRMS = 0.2 mJy beam−1. Bottom right: SDSS DR9 colour image, with LOFAR HBA contours. Contours are at [4, 8, 16]×σ, with σ = 0.3 mJy beam−1. Regions corresponding to the regions used in Fig. 5are marked with dashed red lines in the LOFAR images.
Current usage metrics show cumulative count of Article Views (full-text article views including HTML views, PDF and ePub downloads, according to the available data) and Abstracts Views on Vision4Press platform.
Data correspond to usage on the plateform after 2015. The current usage metrics is available 48-96 hours after online publication and is updated daily on week days.
Initial download of the metrics may take a while.