Fig. 3.
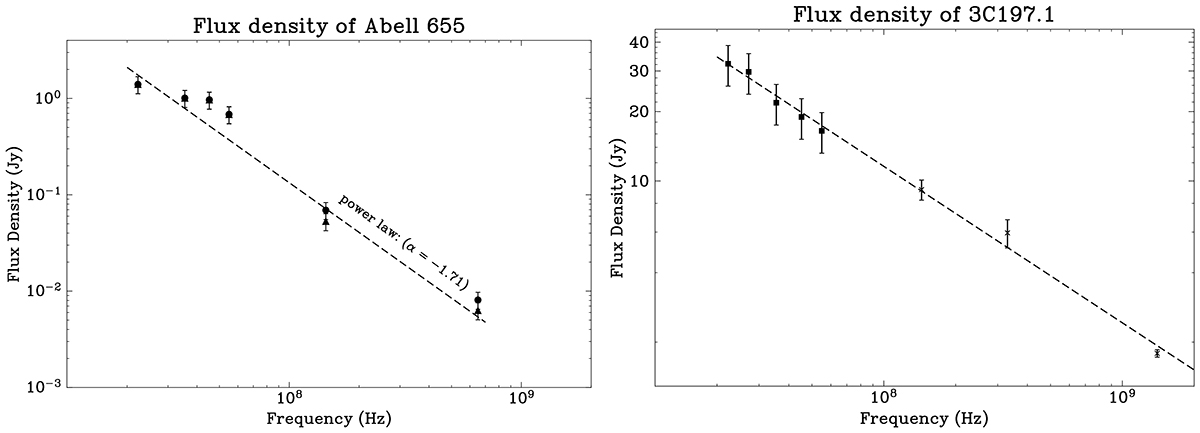
Download original image
Integrated spectra of the cluster and 3C 197.1. Both flux densities with (circles) and without (triangles) point source subtraction are reported in the case of Abell 655. We note that for the LBA flux densities, the contribution of point sources to the total flux density is negligible, which means that the data with and without subtraction of point sources are indistinguishable within the uncertainties. The dotted line represents a power-law spectral profile fitted to the point-source subtracted flux density, and it gives an indication of the steepness of the spectrum of A655, with a spectral index of α = −1.71 ± 0.16. The radio spectrum of 3C 197.1 is that of a regular AGN, with a spectral index of α = −0.68 ± 0, 02, which allows us to determine the validity of our LOFAR flux density measurements.
Current usage metrics show cumulative count of Article Views (full-text article views including HTML views, PDF and ePub downloads, according to the available data) and Abstracts Views on Vision4Press platform.
Data correspond to usage on the plateform after 2015. The current usage metrics is available 48-96 hours after online publication and is updated daily on week days.
Initial download of the metrics may take a while.