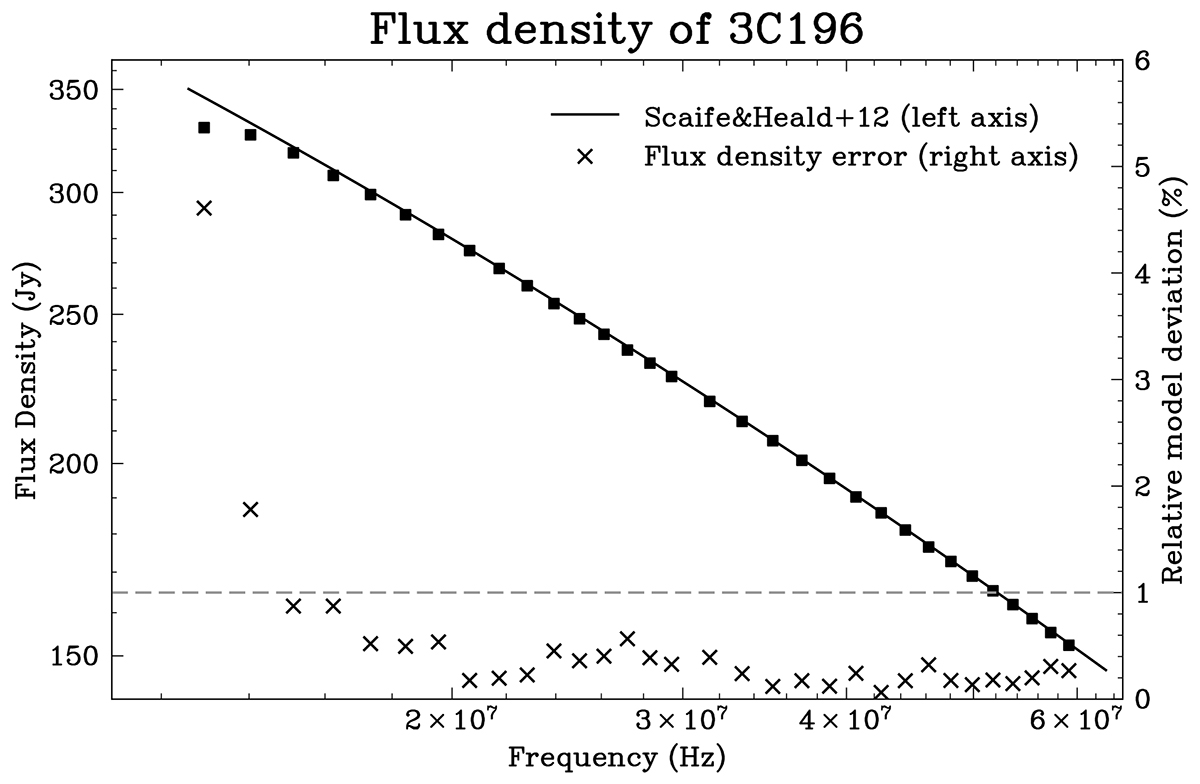
Fig. 2.
Download original image
Flux density of 3C 196, as measured after initial calibration. As the data was calibrated against a (Scaife & Heald 2012) flux scale model of 3C 196, the deviation from the model should be minimal. Deviations from the flux scale indicate instability in the calibration, which means that the corresponding data should be discarded. This figure shows that data below 15 MHz is too unreliable to be used.
Current usage metrics show cumulative count of Article Views (full-text article views including HTML views, PDF and ePub downloads, according to the available data) and Abstracts Views on Vision4Press platform.
Data correspond to usage on the plateform after 2015. The current usage metrics is available 48-96 hours after online publication and is updated daily on week days.
Initial download of the metrics may take a while.