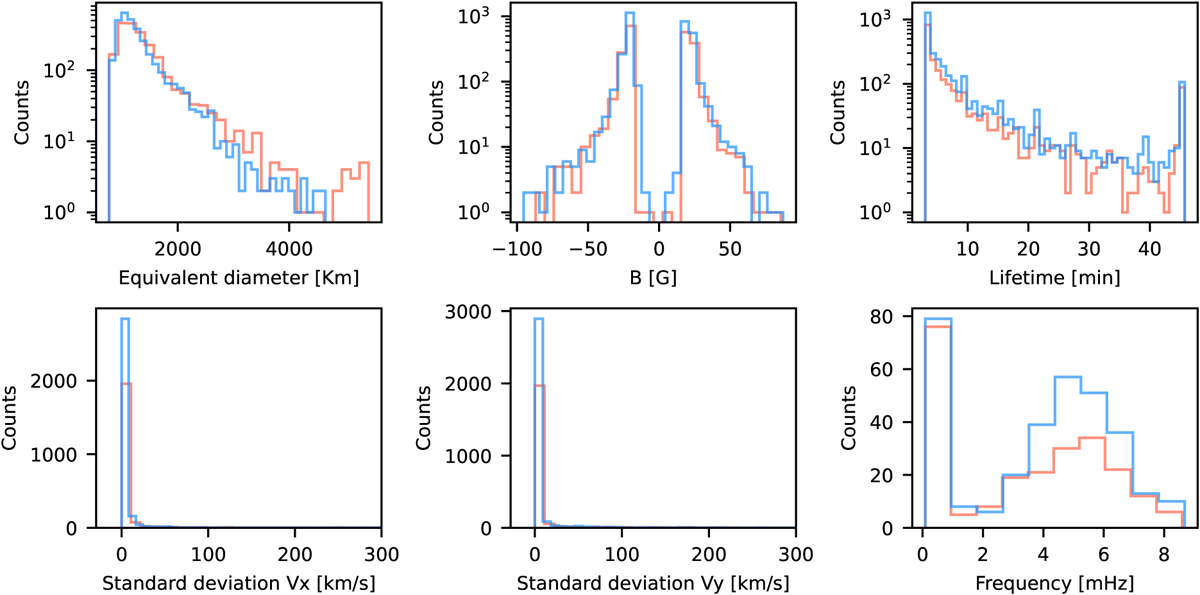
Fig. A.1
Download original image
Statistical distributions of the physical properties inferred by the tracking code. The orange distributions correspond to the coarse detection method, while the blue distributions correspond to the fine detection method. From left to right, top to bottom: equivalent diameter, magnetic field, lifetime, standard deviation of vx and vy, and the distribution of the dominant frequency of vx following the same procedure of Berretti et al. (2024).
Current usage metrics show cumulative count of Article Views (full-text article views including HTML views, PDF and ePub downloads, according to the available data) and Abstracts Views on Vision4Press platform.
Data correspond to usage on the plateform after 2015. The current usage metrics is available 48-96 hours after online publication and is updated daily on week days.
Initial download of the metrics may take a while.