Fig. 3
Download original image
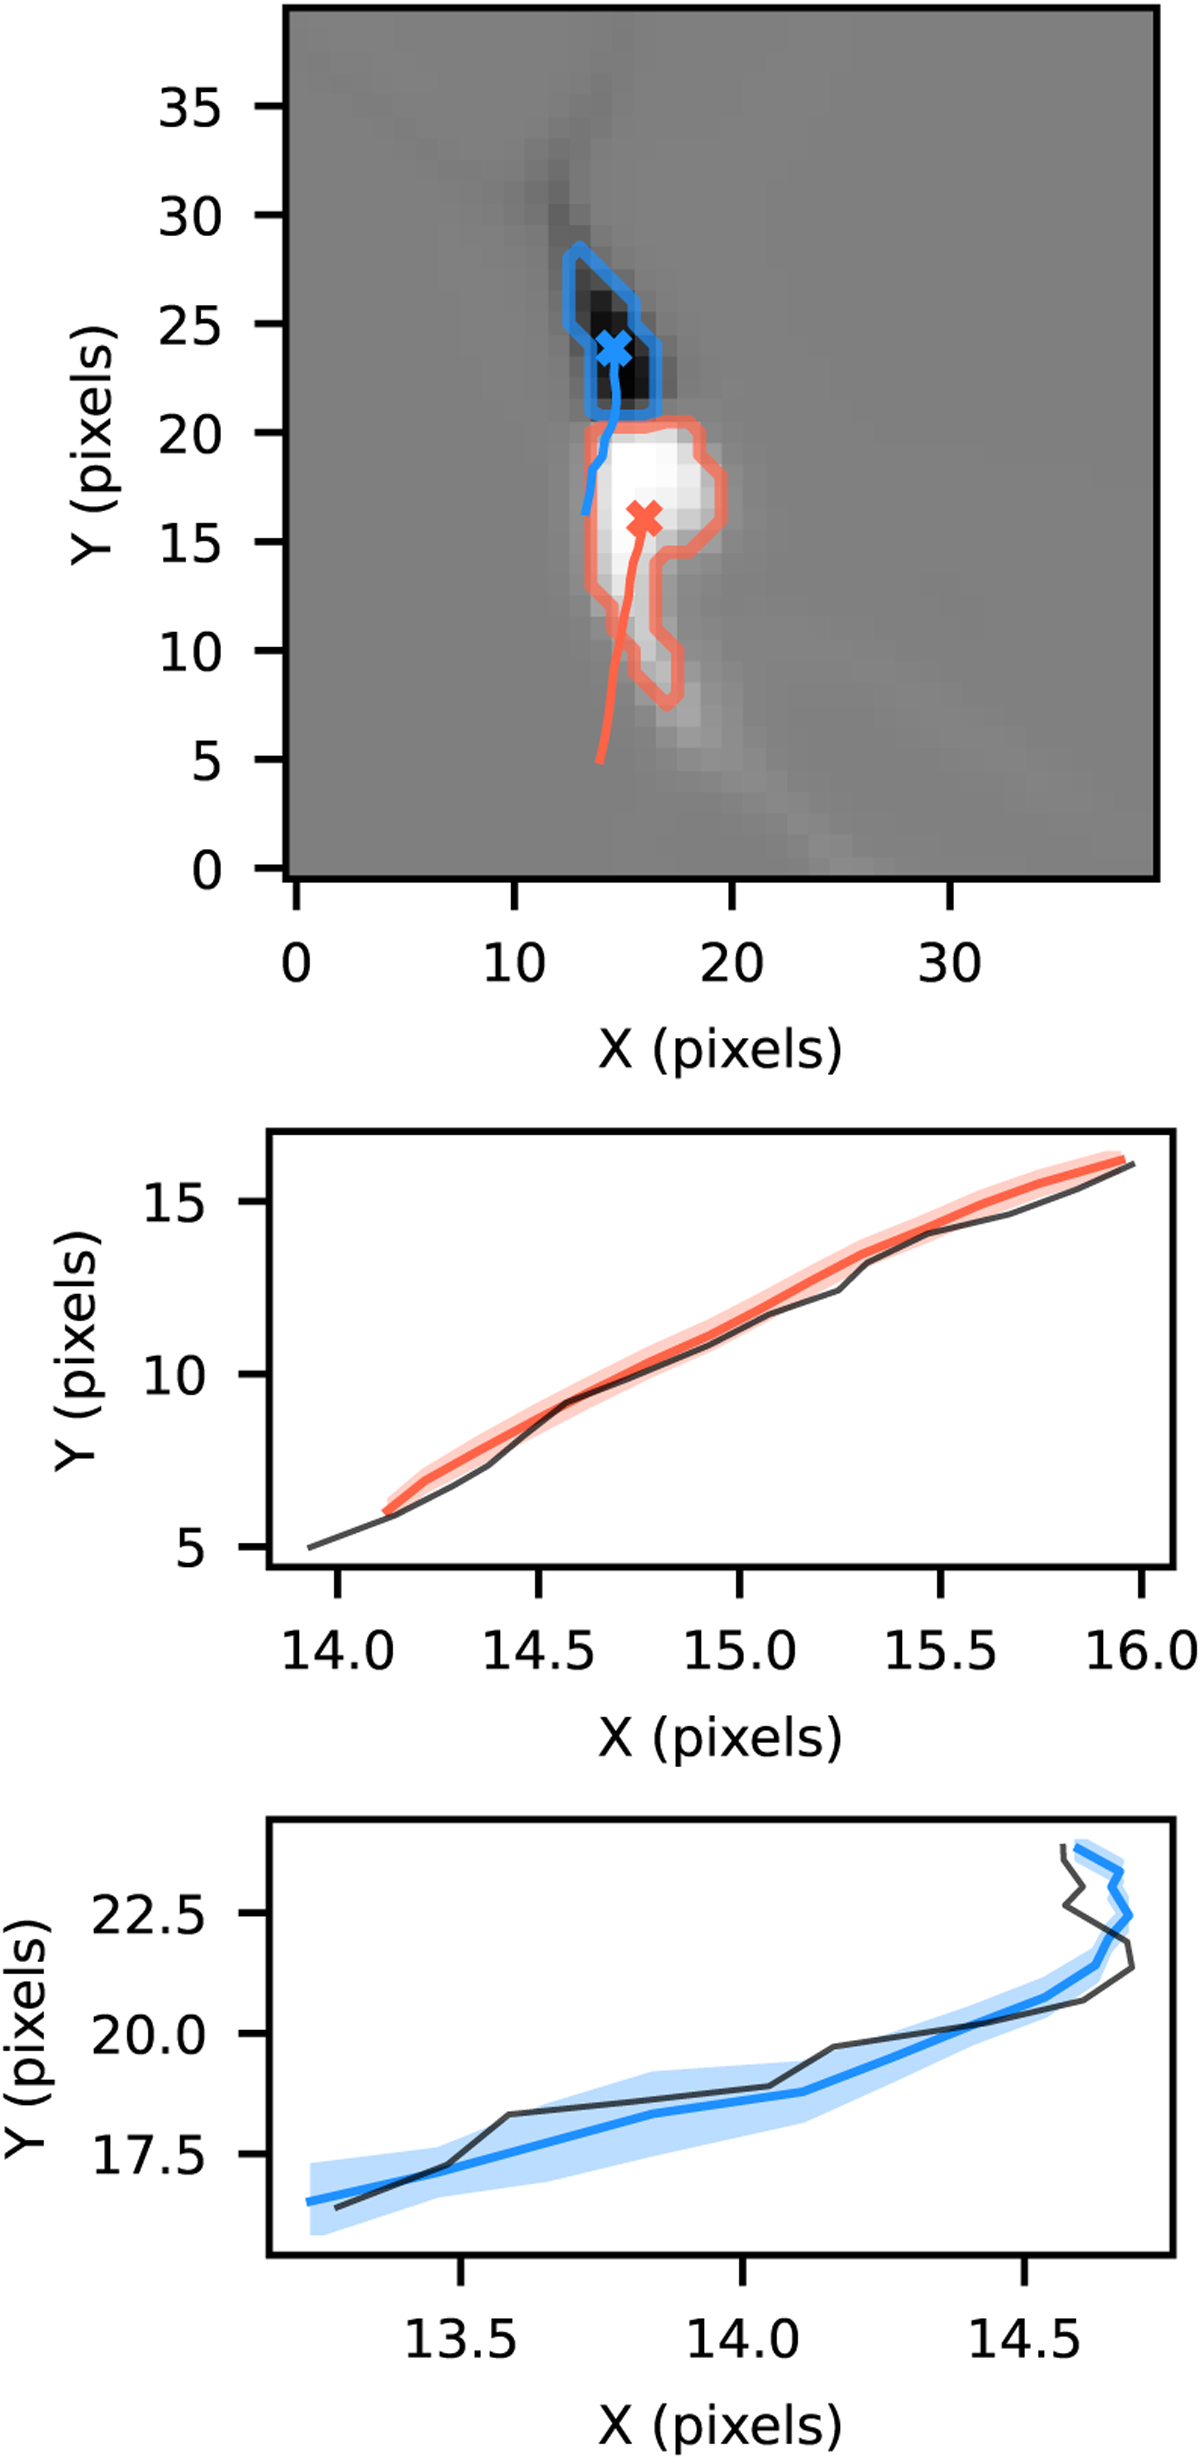
Comparison of the actual and tracked trajectories of a bipolar magnetic structures obtained from Bifrost simulations. The dataset consists of 15 frames. The detected contours and actual trajectories are shown in orange and blue respectively for element one and two. The black line represent the actual trajectories of the two features, obtained by tracking directly in the Bifrost simulated magnetograms. The orange and blue lines show the trajectories tracked by SoFT over N = 100 iterations with a noise level of 12.5% of the maximum value of B added to the original image. The shaded areas represent the standard deviation for each frame relative to the average path.
Current usage metrics show cumulative count of Article Views (full-text article views including HTML views, PDF and ePub downloads, according to the available data) and Abstracts Views on Vision4Press platform.
Data correspond to usage on the plateform after 2015. The current usage metrics is available 48-96 hours after online publication and is updated daily on week days.
Initial download of the metrics may take a while.