Fig. 2
Download original image
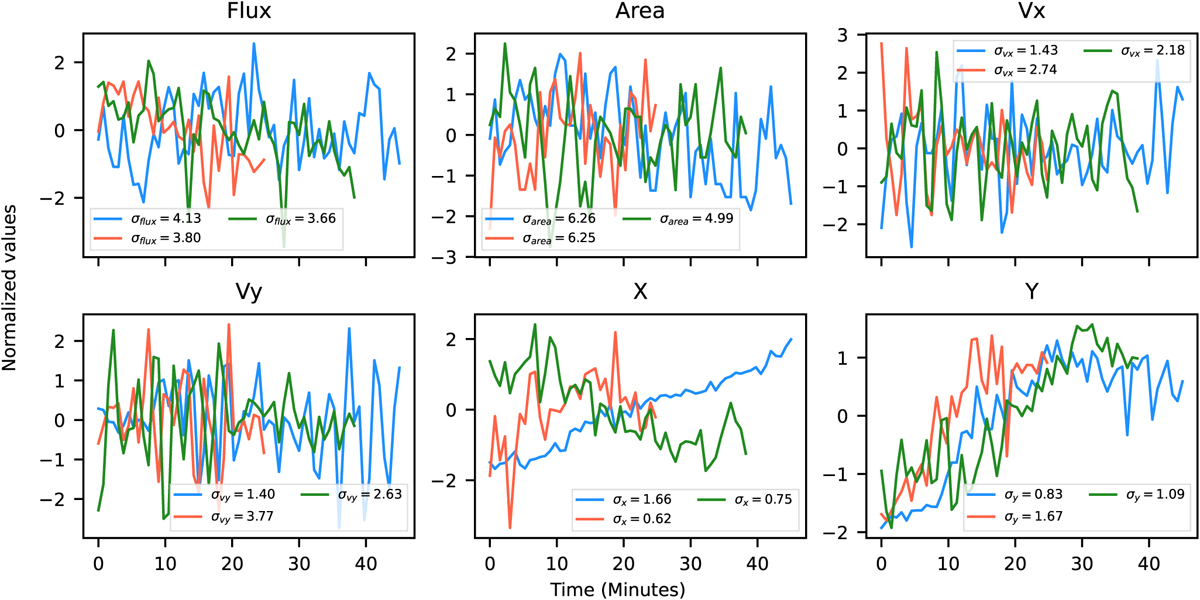
Time series of physical observables obtained from the SoFT tracking code using the finer detection method for three randomly selected elements within the dataset. These plots show the evolution over time of key physical parameters of the magnetic structures, such as magnetic flux, area, horizontal velocity in both x and y directions, and their positions in pixel coordinates. The time series are adjusted to a zero mean and scaled by their respective standard deviations to improve visualisation and the value of σ is reported in the legend. Units of measure of the standard deviations are Gauss for flux, pixels2 for area, km/s for velocities, and pixels for positions.
Current usage metrics show cumulative count of Article Views (full-text article views including HTML views, PDF and ePub downloads, according to the available data) and Abstracts Views on Vision4Press platform.
Data correspond to usage on the plateform after 2015. The current usage metrics is available 48-96 hours after online publication and is updated daily on week days.
Initial download of the metrics may take a while.