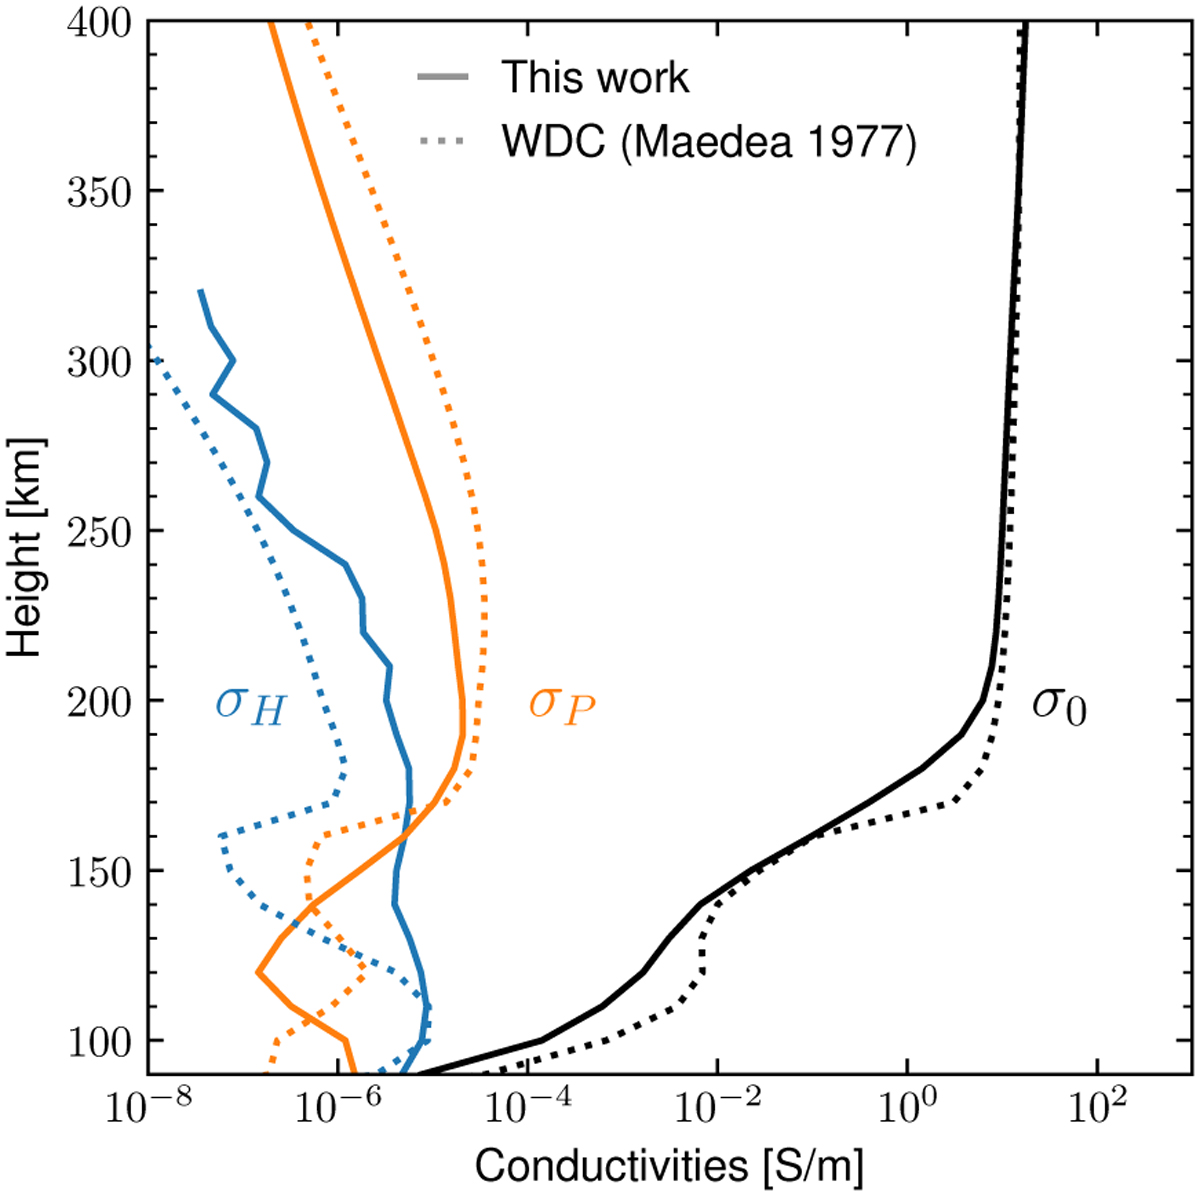
Fig. B.1
Download original image
Comparison of the conductivity profiles of the Earth. The profiles obtained from the WDC ionospheric conductivity model (https://wdc.kugi.kyoto-u.ac.jp/ionocond/sightcal/index.html) are shown as dotted lines. The profiles obtained with the formulation derived in Sect. 2.1 are shown as solid lines. The field-free conductivity σ0 (Eq. 15) is shown in black, the Pedersen conductivity (Eq. 17) in orange, and the Hall conductivity (Eq. 16) in blue.
Current usage metrics show cumulative count of Article Views (full-text article views including HTML views, PDF and ePub downloads, according to the available data) and Abstracts Views on Vision4Press platform.
Data correspond to usage on the plateform after 2015. The current usage metrics is available 48-96 hours after online publication and is updated daily on week days.
Initial download of the metrics may take a while.