Open Access
Fig. 7.
Download original image
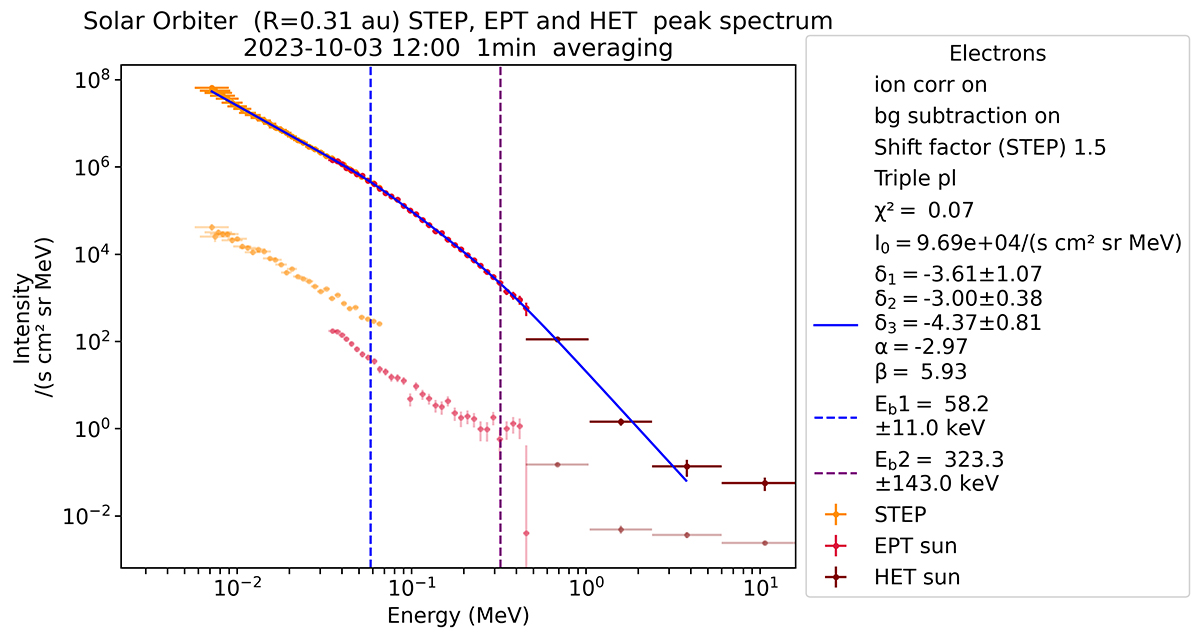
Energetic electron peak intensity spectrum measured by Solar Orbiter/EPD. The lower and fainter points represent the pre-event background, while the higher points represent the peak intensity measured by STEP, EPT, and HET. The spectrum is fit with a triple power law, excluding the last energy channel of HET.
Current usage metrics show cumulative count of Article Views (full-text article views including HTML views, PDF and ePub downloads, according to the available data) and Abstracts Views on Vision4Press platform.
Data correspond to usage on the plateform after 2015. The current usage metrics is available 48-96 hours after online publication and is updated daily on week days.
Initial download of the metrics may take a while.