Fig. 5.
Download original image
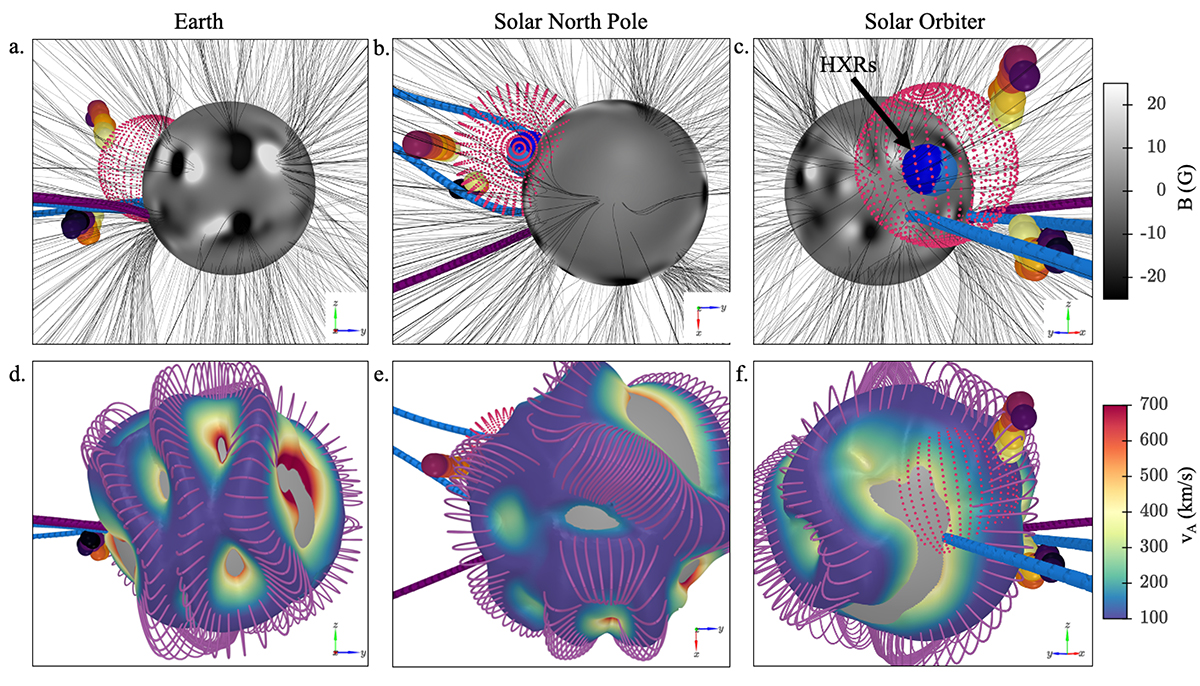
3D locations of the type II radio bursts, HXR footpoints, and CME combined with the MHD model results. The locations are shown from three different perspectives: Earth (left), solar north pole (middle), and Solar Orbiter (right) in Stonyhurst heliographic coordinates. The axis in each panel shows the orientation of the coordinate system where the x-axis points roughly along the Sun–Earth line. Panels a–c: Radio source centroids in 3D (coloured spheres) together with the HXR footpoints (blue spheres overlaid on the solar surface in panels b and c) and a reconstruction of the CME shock (pink wireframe). These are overlaid on an HMI magnetogram used as input to the MAST model and and open field lines (black) including field lines connecting to Solar Orbiter (blue) and PSP (purple). Panels d–f: Density iso-surface corresponding to the harmonic plasma frequency level of 76 MHz overlaid with values of Alfvén speed at the heights corresponding to the density surface and closed magnetic field lines in purple. The grey sphere underneath the surface denote a radius of 1.4 R⊙.
Current usage metrics show cumulative count of Article Views (full-text article views including HTML views, PDF and ePub downloads, according to the available data) and Abstracts Views on Vision4Press platform.
Data correspond to usage on the plateform after 2015. The current usage metrics is available 48-96 hours after online publication and is updated daily on week days.
Initial download of the metrics may take a while.