Fig. 4.
Download original image
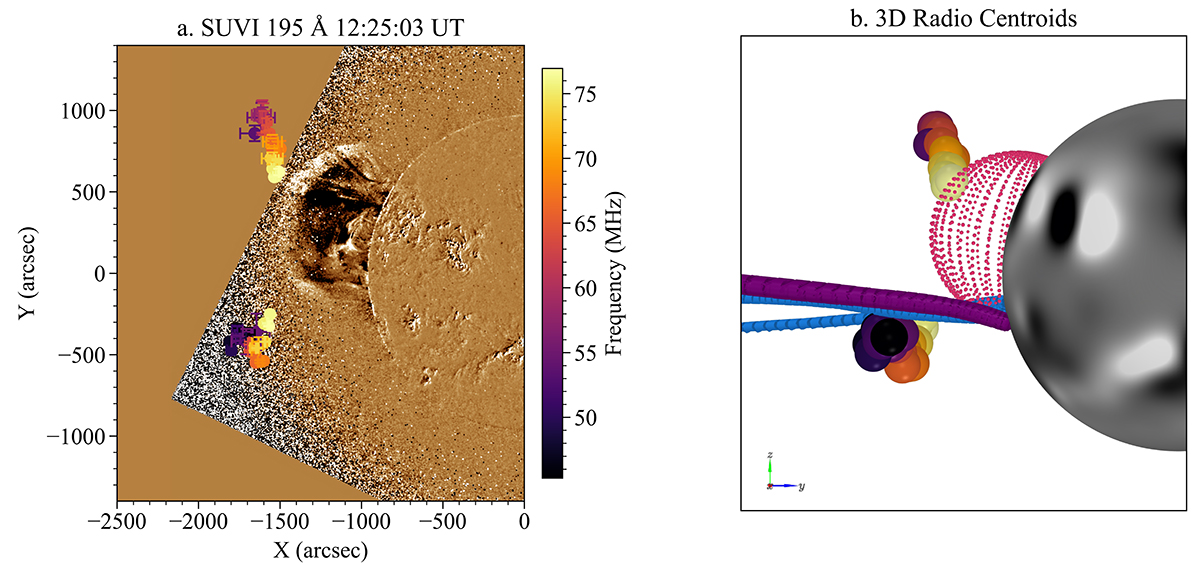
Type II emission centroids and their reconstruction in 3D. (a) Radio source centroids at 12:24:57 UT, where the colour bar denotes the observing frequency in MHz, overlaid on a GOES/SUVI 195 Å image in helioprojective coordinates. (b) Radio source centroids in 3D together with a reconstruction of the CME shock (pink wireframe) and open field lines connecting to Solar Orbiter (blue) and PSP (purple) in Stonyhurst heliographic coordinates.
Current usage metrics show cumulative count of Article Views (full-text article views including HTML views, PDF and ePub downloads, according to the available data) and Abstracts Views on Vision4Press platform.
Data correspond to usage on the plateform after 2015. The current usage metrics is available 48-96 hours after online publication and is updated daily on week days.
Initial download of the metrics may take a while.