Fig. 3.
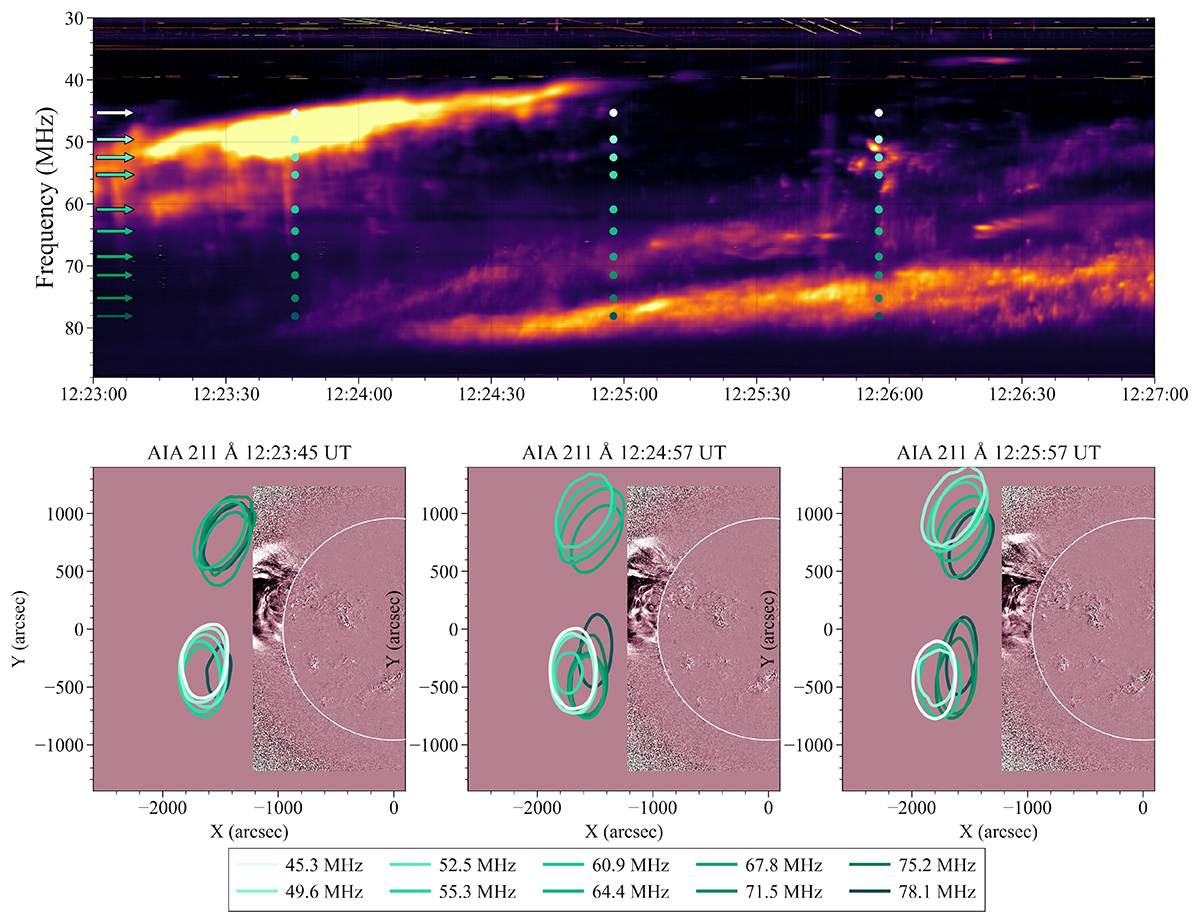
Download original image
The type II burst in dynamic spectrum and radio images. The top panel shows a zoomed-in dynamic spectrum of the onset of the type II harmonic lanes. The arrows located to the left of this panel represent the frequency sub-bands that were imaged in the bottom panels. The bottom panels show the 70% radio contours at the time and frequencies denoted in the top panel using the same colouring, overlaid on AIA 211 Å running difference images of the eruption. The radio contours and AIA images have the same time stamps, as shown in the panels. The time labels in this figure are UT observer times.
Current usage metrics show cumulative count of Article Views (full-text article views including HTML views, PDF and ePub downloads, according to the available data) and Abstracts Views on Vision4Press platform.
Data correspond to usage on the plateform after 2015. The current usage metrics is available 48-96 hours after online publication and is updated daily on week days.
Initial download of the metrics may take a while.