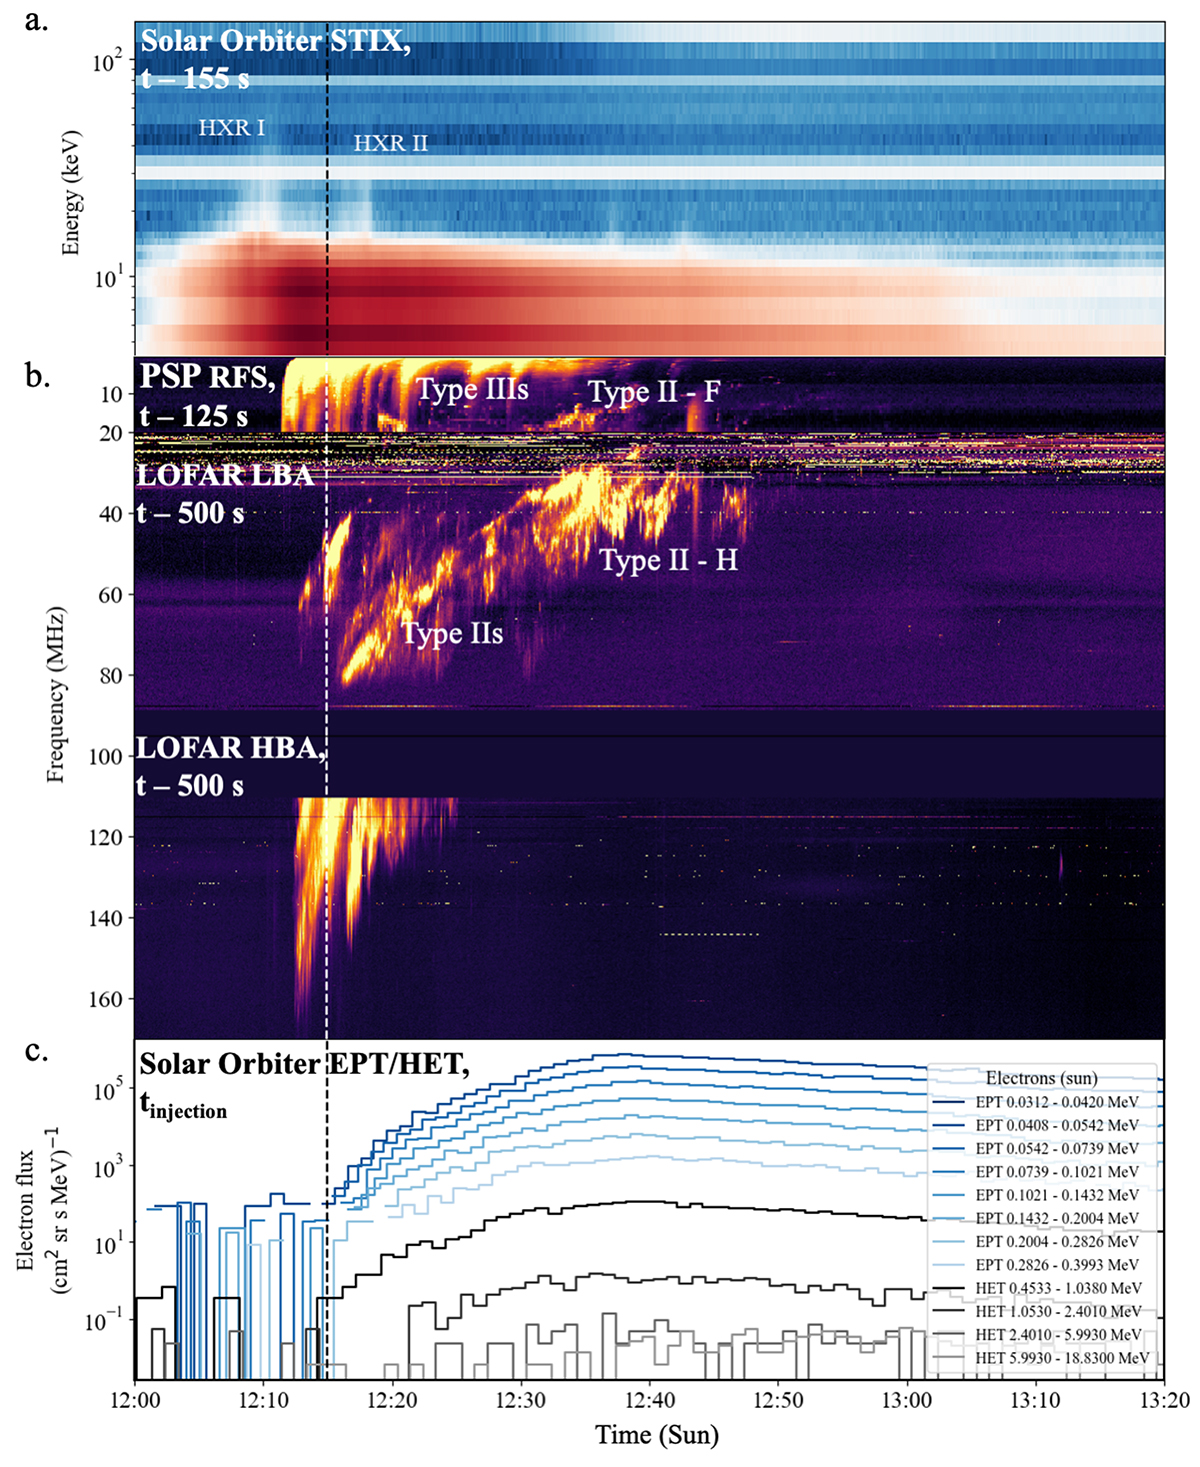
Fig. 2.
Download original image
X-ray spectrogram, composite dynamic spectrum of a complex radio event, and energetic electron time series observed on 3 October 2023. (a) X-ray spectrogram from Solar Orbiter/STIX showing the onset of the flare and the presence of two hard X-ray peaks: HXR I and HXR II. (b) Dynamic spectrum consisting of spectra from PSP/RFS (1–20 MHz), LOFAR LBA (10–90 MHz), and LOFAR HBA (110–170 MHz). The labels ‘F’ and ‘H’ refer to fundamental and harmonic emissions, respectively. (c) Time series of energetic electrons measured by Solar Orbiter EPT & HET from the sunward direction (where the first-arriving electrons are observed) and at multiple energy channels. The time represents the injection time for each channel. The spectra are time-shifted to correspond to the time at the Sun so that they can be compared directly to the electron injection times.
Current usage metrics show cumulative count of Article Views (full-text article views including HTML views, PDF and ePub downloads, according to the available data) and Abstracts Views on Vision4Press platform.
Data correspond to usage on the plateform after 2015. The current usage metrics is available 48-96 hours after online publication and is updated daily on week days.
Initial download of the metrics may take a while.