Fig. C.2.
Download original image
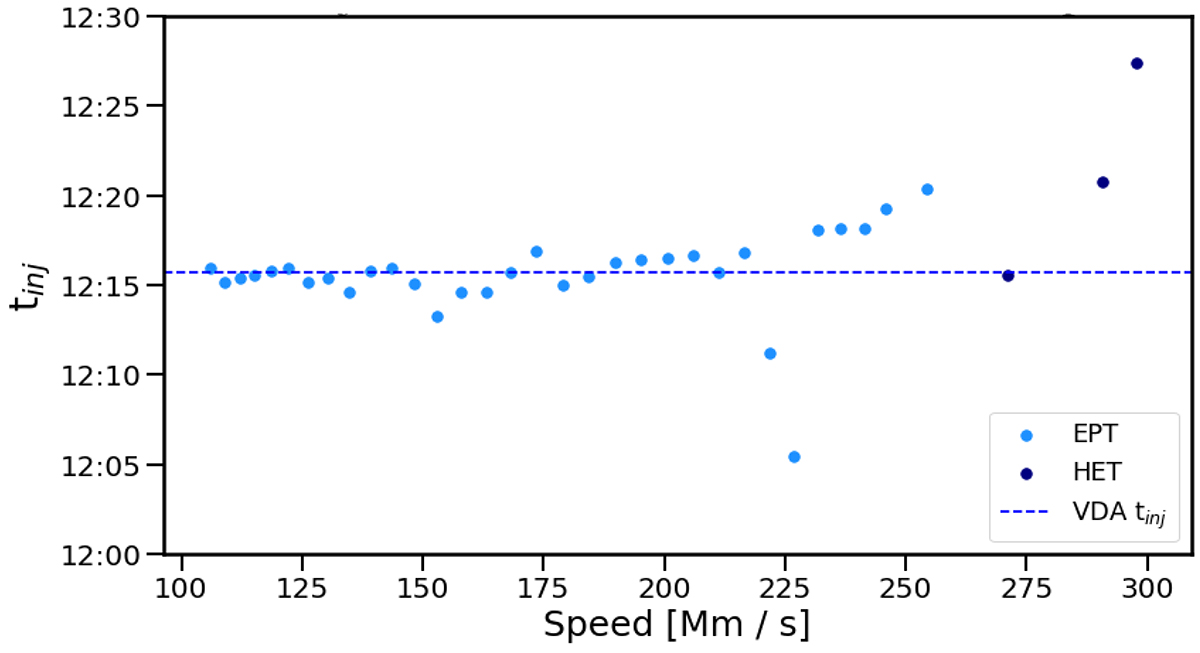
Scatter plot showing the injection times acquired by a simple time-shift (tinj = tonset − L/v) for EPT and HET onset times. The horizontal dashed blue line represents the injection time predicted by VDA (Fig. C.1). Largely static injection time as a function of energy, assuming the electrons travelled the same path, suggests a common time of injection.
Current usage metrics show cumulative count of Article Views (full-text article views including HTML views, PDF and ePub downloads, according to the available data) and Abstracts Views on Vision4Press platform.
Data correspond to usage on the plateform after 2015. The current usage metrics is available 48-96 hours after online publication and is updated daily on week days.
Initial download of the metrics may take a while.