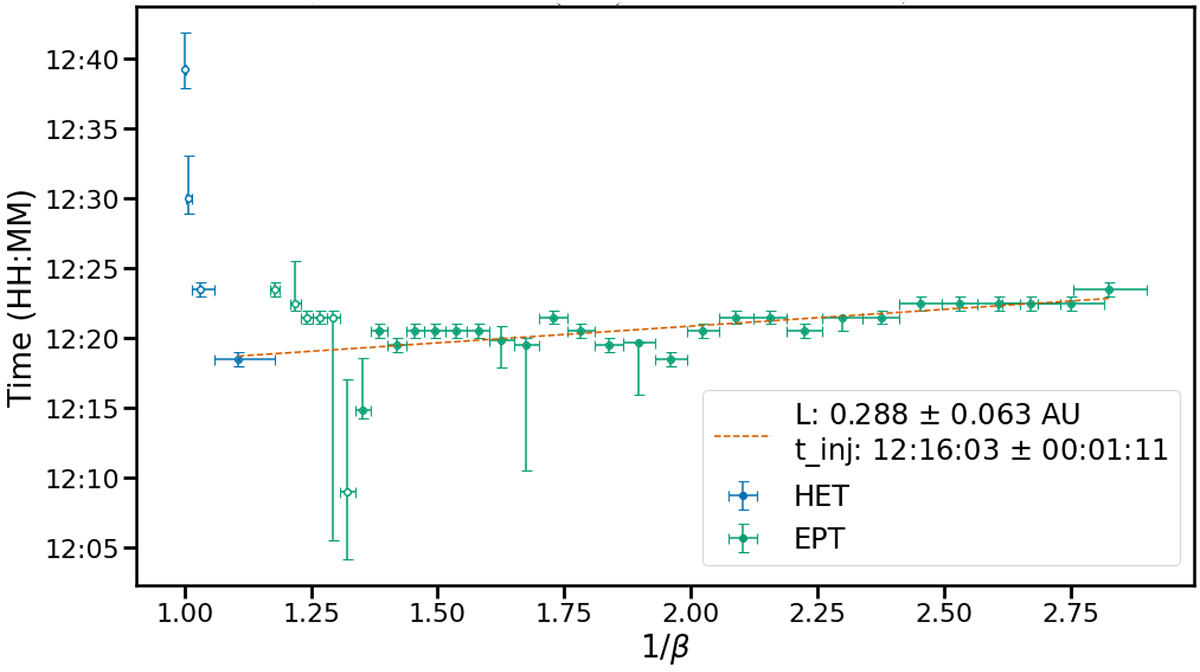
Fig. C.1.
Download original image
Velocity dispersion analysis plot on Solar Orbiter EPT+HET electron onset times. Horizontal axis corresponds to the inverse unitless velocity of the electrons (1/β = c/v) and the vertical axis shows time. Data points mark the onset times, with horizontal error bars displaying the width of each energy channel and vertical error displaying the uncertainty related to the onset times. The dashed orange line shows a linear fit applied on the selected (solid circles) onset times using orthogonal distance regression (ODR) algorithm. Onset times marked with hollow circles are not considered to the fit for their deviance from the general velocity dispersion trend.
Current usage metrics show cumulative count of Article Views (full-text article views including HTML views, PDF and ePub downloads, according to the available data) and Abstracts Views on Vision4Press platform.
Data correspond to usage on the plateform after 2015. The current usage metrics is available 48-96 hours after online publication and is updated daily on week days.
Initial download of the metrics may take a while.