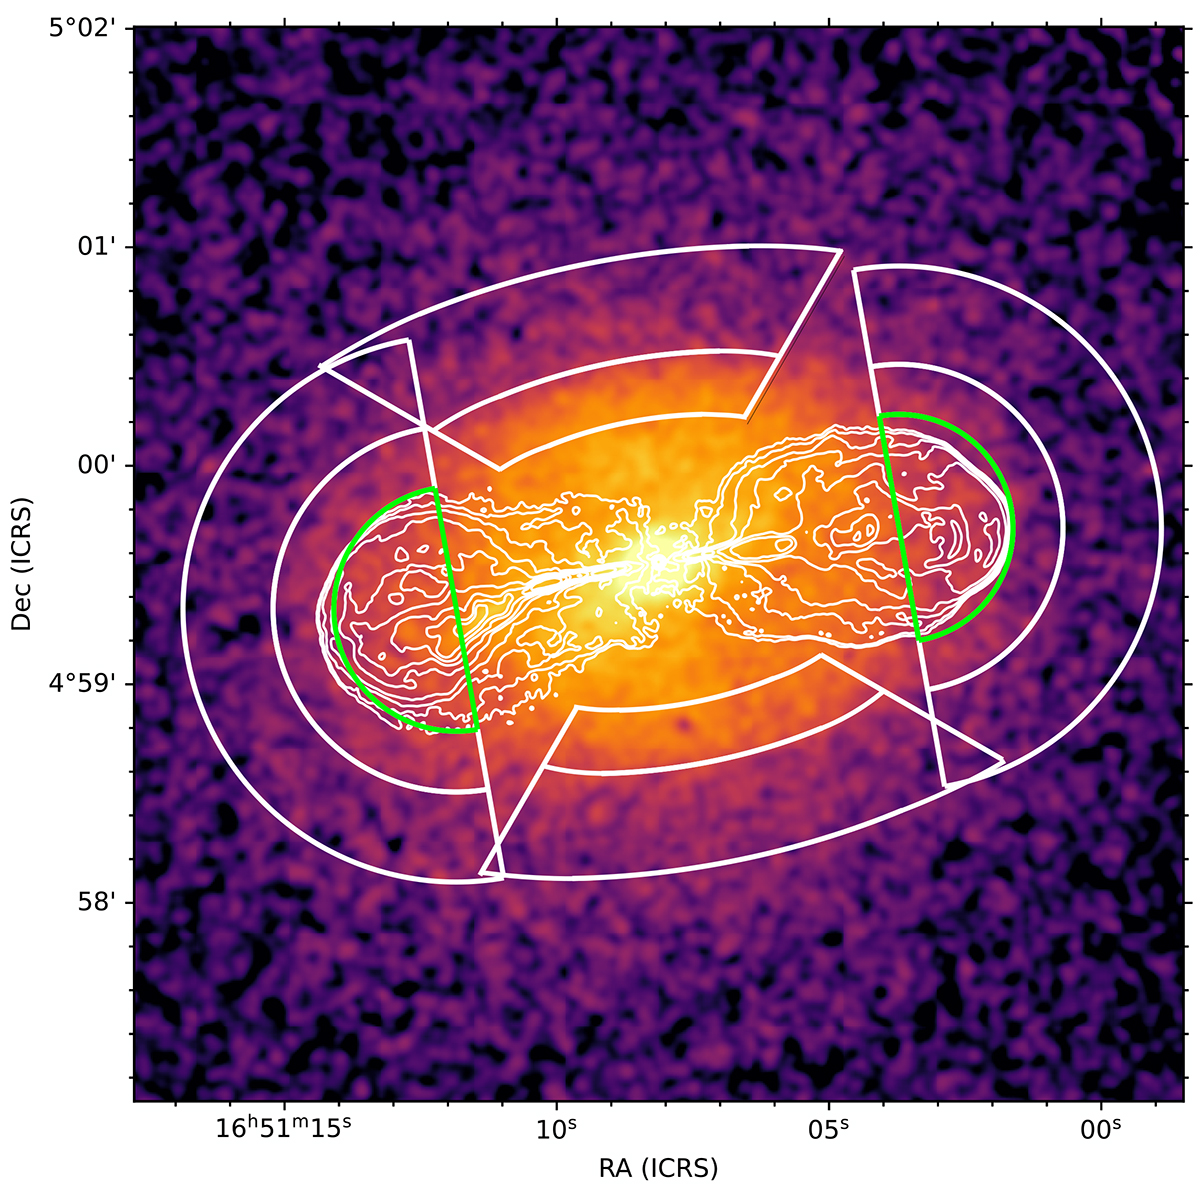
Fig. A.1.
Download original image
Downstream and upstream regions used for the spectral analysis of the north-south and east-west shock fronts in Hercules A (white wedges), overlaid onto the 0.5 – 7 keV Chandra image of the cluster. A third outer wedge extending to the edge of the field of view was used to deproject the spectra (not shown here). The green semicircles mark the regions used for the spectral analysis of IC emission from the radio lobes. Radio contours are the same as in Fig. 2. See Sects. 3.2.1 and 3.2.3 for details.
Current usage metrics show cumulative count of Article Views (full-text article views including HTML views, PDF and ePub downloads, according to the available data) and Abstracts Views on Vision4Press platform.
Data correspond to usage on the plateform after 2015. The current usage metrics is available 48-96 hours after online publication and is updated daily on week days.
Initial download of the metrics may take a while.