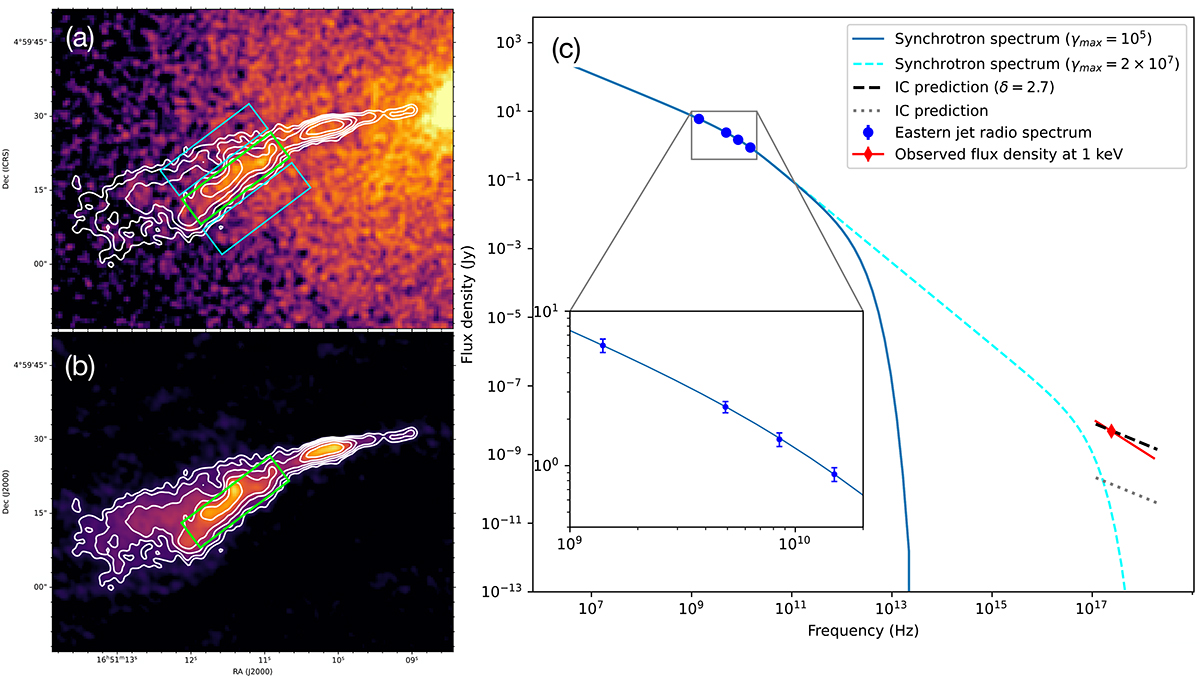
Fig. 5.
Download original image
Eastern X-ray jet. Panel (a): 0.5–7 keV Chandra image with 14.9 GHz radio contours overlaid in white. The contours start at 3σrms = 0.6 mJy/beam and increase by a factor of 2. The green box is the region of enhanced X-ray emission along the eastern radio jet. Cyan boxes show the background extraction regions. The spectral analysis of its emission is reported in Sect. 3.2.2. Panel (b): 14.9 GHz VLA image of Hercules A, with contours defined as in the left panel. The beam FWHM is 1.8″ × 1.4″. Panel (c): radio to X-ray spectrum of the eastern X-ray jet within the green box. The blue points are the flux densities at 1.5, 4.9, 8.5 and 14.9 GHz, while the red diamond is the measured flux density at 1 keV. The blue solid and cyan dashed lines represent the synchrotron model describing the radio spectrum for γmax = 105 and γmax = 2 × 10⁷, respectively. The dashed black and dotted gray lines show the prediction for IC of the CMB from the electrons powering the synchrotron emission, with and without Doppler boosting (see Sects. 3.2.2 and 4.2.1 for details).
Current usage metrics show cumulative count of Article Views (full-text article views including HTML views, PDF and ePub downloads, according to the available data) and Abstracts Views on Vision4Press platform.
Data correspond to usage on the plateform after 2015. The current usage metrics is available 48-96 hours after online publication and is updated daily on week days.
Initial download of the metrics may take a while.