Fig. 4.
Download original image
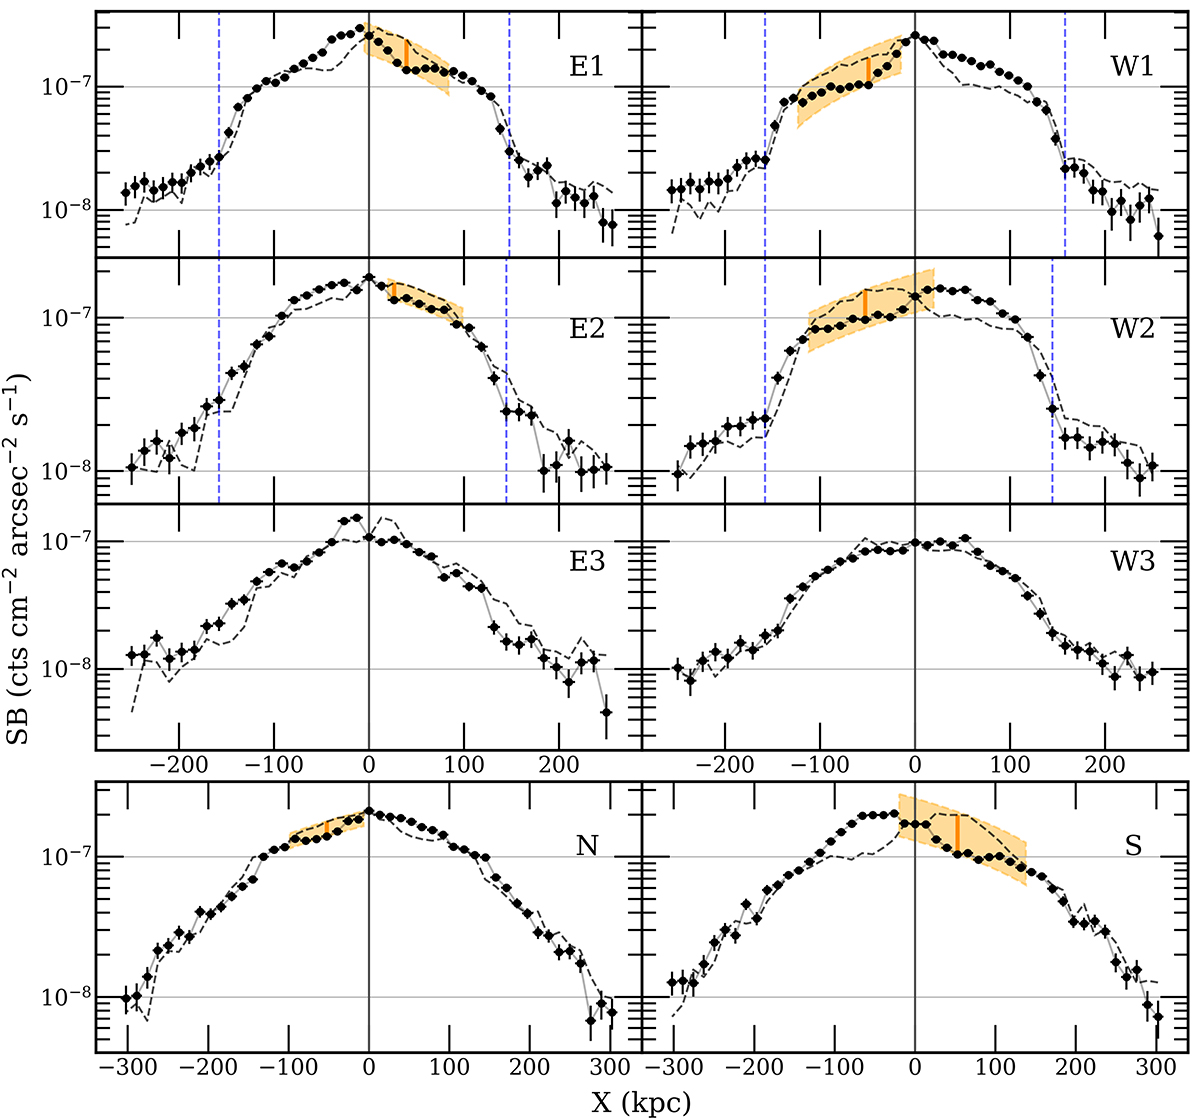
Surface brightness cuts parallel and perpendicular to the radio axis. The labels correspond to those in Fig. 3. The upper 3 rows are cuts from regions W1-W3 and E1-W3, where the positive x axis corresponds to the northern part of Hercules A. The lowest row is cuts from regions N and S, where the positive x axis corresponds to the western part of Hercules A. The dashed black lines are reflections of the solid lines about the central bin (x = 0). The orange boxes illustrate the location of the cavities; within them the solid red lines mark the location of the greatest brightness deficit.
Current usage metrics show cumulative count of Article Views (full-text article views including HTML views, PDF and ePub downloads, according to the available data) and Abstracts Views on Vision4Press platform.
Data correspond to usage on the plateform after 2015. The current usage metrics is available 48-96 hours after online publication and is updated daily on week days.
Initial download of the metrics may take a while.