Fig. 3.
Download original image
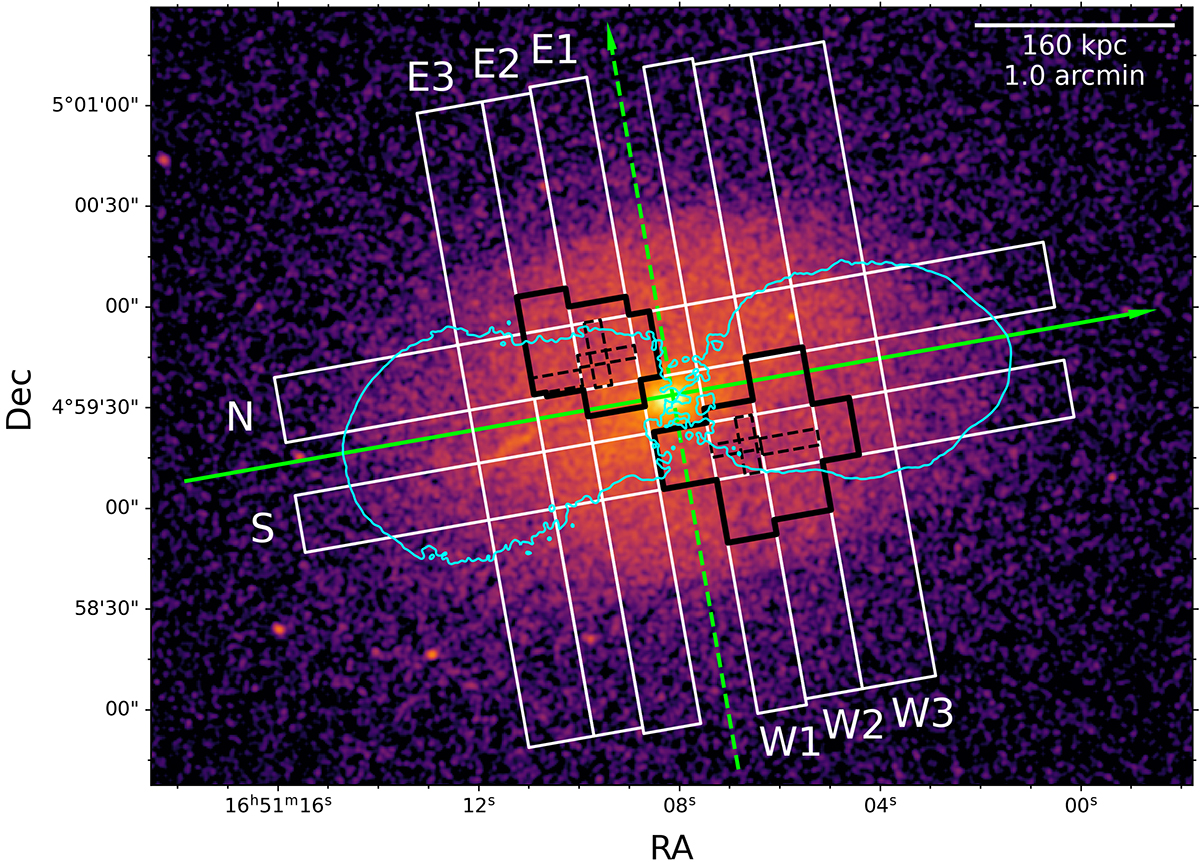
Extraction regions of surface brightness profiles across the X-ray cavities of Hercules A. The rectangular white regions were used to extract the surface brightness profiles perpendicular and parallel to the radio axis, and are shown along with their labels. The solid black polygons encompass the cavity-related bins in each region. The dashed black rectangles mark the bin of the maximum deficit. The solid green line is aligned with the radio axis, where centers of the central bins of perpendicular cuts are positioned. The dashed green line, where the centers of the central bins of the parallel cuts is positioned, is perpendicular to the solid line. The cyan contour from the 1.4 GHz ABC-configurations VLA is at 3σrms = 0.3 mJy/beam.
Current usage metrics show cumulative count of Article Views (full-text article views including HTML views, PDF and ePub downloads, according to the available data) and Abstracts Views on Vision4Press platform.
Data correspond to usage on the plateform after 2015. The current usage metrics is available 48-96 hours after online publication and is updated daily on week days.
Initial download of the metrics may take a while.