Fig. 2.
Download original image
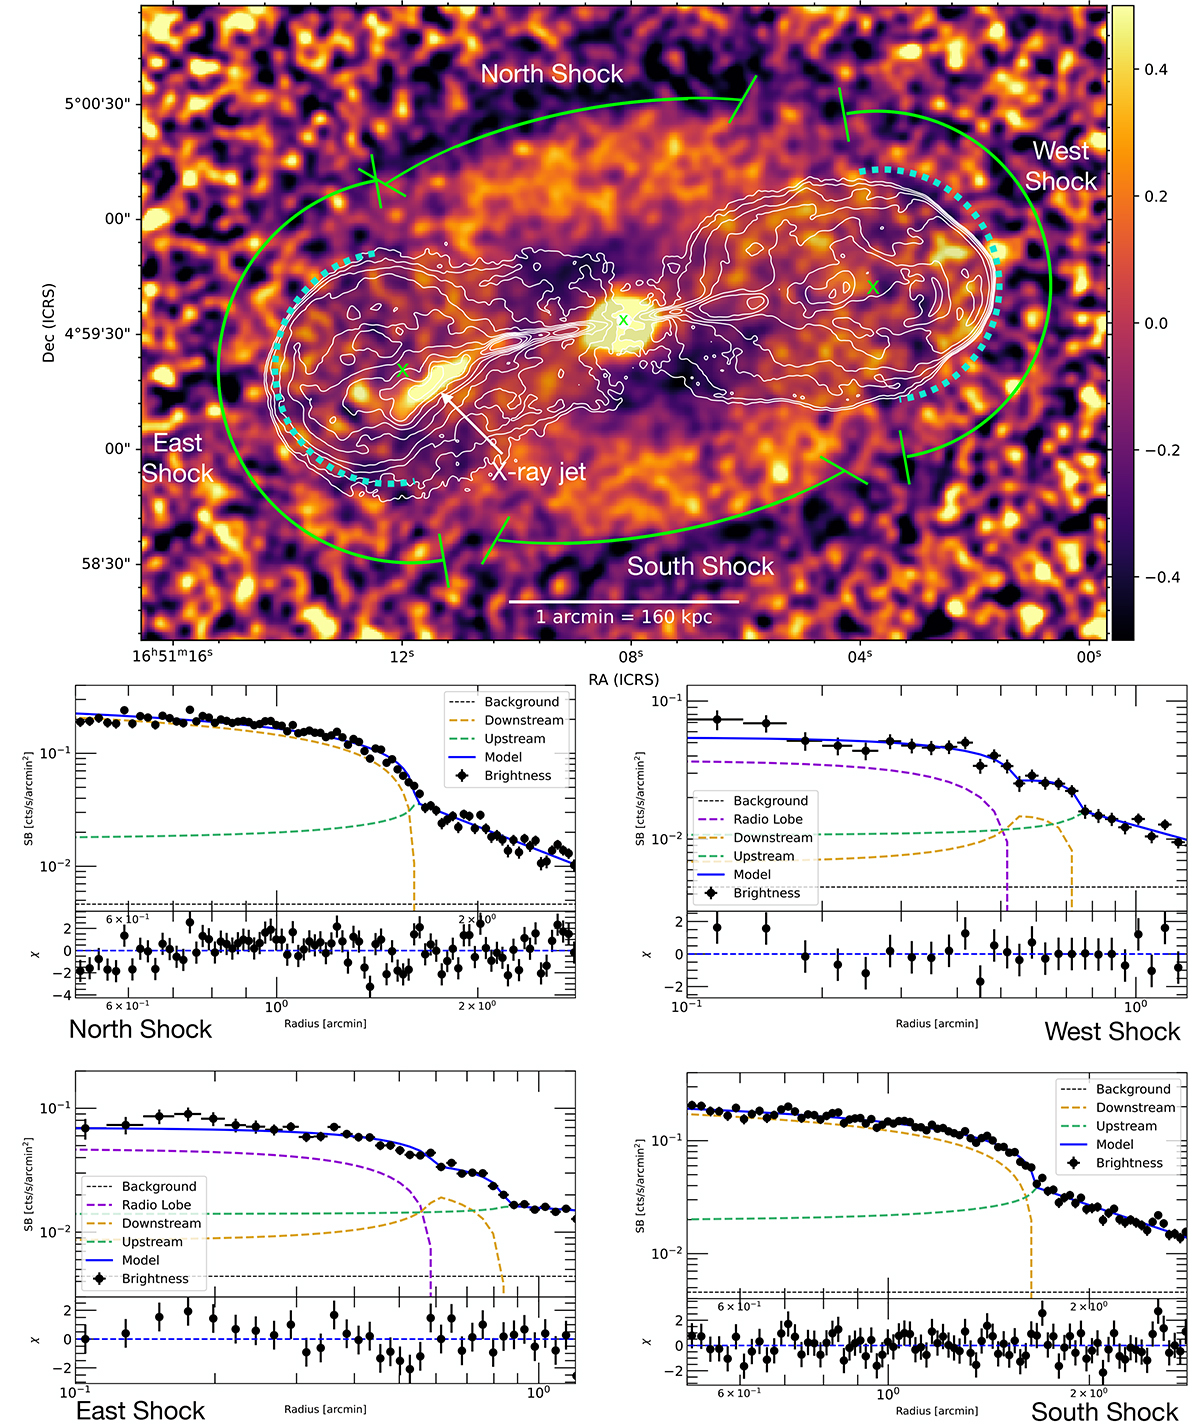
Analysis of surface brightness profiles across the shocks of Hercules A. Top panel: Chandra unsharp masked image with 1.4 GHz ABC-configurations contours overlaid in white. Contours start at 3σrms = 0.3 mJy/beam and increase by a factor of 2. Green solid arcs show the position of the discontinuities and features identified in the surface brightness profiles centered in the green crosses. Cyan dotted arcs show the best-fit radius of the sphere of constant emission used to fit the surface brightness profile of the X-ray emission within the radio lobes. Bottom panels: surface brightness profiles across the north, west, south, and east edges, fitted with a broken power-law model. The solid and dashed lines show the total model and the model components, respectively, projected along the line of sight. The black dotted line shows the background. For the north-south edges, the x-axis is relative to the major axis of the ellipse with ellipticity 1.75 and position angle 10°. Best fit parameters are reported in Table 1. For the east and west shocks, the profile was fit by combining the broken power-law model with a sphere of constant emission projected along the line of sight, to take into account the X-ray emission from the radio lobes. The best-fit profile shows the boundary of the radio lobes and of the shock front.
Current usage metrics show cumulative count of Article Views (full-text article views including HTML views, PDF and ePub downloads, according to the available data) and Abstracts Views on Vision4Press platform.
Data correspond to usage on the plateform after 2015. The current usage metrics is available 48-96 hours after online publication and is updated daily on week days.
Initial download of the metrics may take a while.