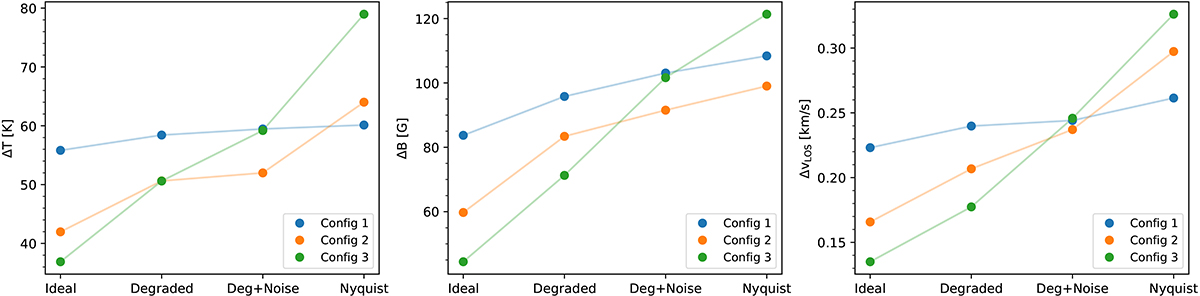
Fig. 8.
Download original image
Average error between the inferred and the original values from the simulation in the range log τ500 = [ − 0.5, −1.5] for different scenarios and different inversion configurations. The error is measured as the standard deviation. The left panel shows the error in temperature, the middle magnetic field strength, and the right panel velocity. In each panel from left to right: inversions using the original spectra, degraded spectra, degraded spectra with noise, and degraded spectra with noise sampled according to the Nyquist-Shannon theorem at the corresponding spectral resolution.
Current usage metrics show cumulative count of Article Views (full-text article views including HTML views, PDF and ePub downloads, according to the available data) and Abstracts Views on Vision4Press platform.
Data correspond to usage on the plateform after 2015. The current usage metrics is available 48-96 hours after online publication and is updated daily on week days.
Initial download of the metrics may take a while.