Fig. 7.
Download original image
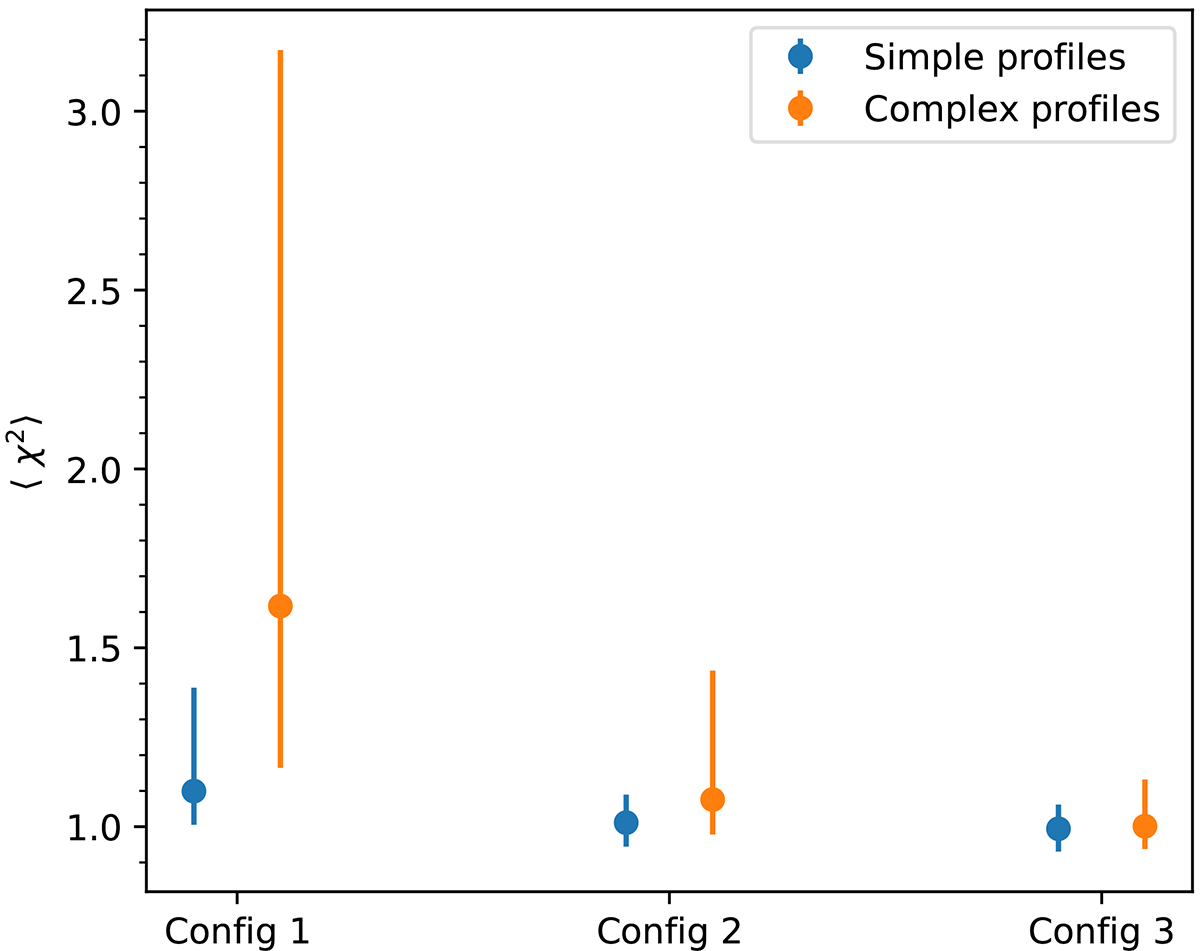
Quality of the inversions for the different node configurations of increasing complexity (see Table 1). The filled circles are the average χ2 (Eq. (4)) calculated for profiles whose total dimensionality is smaller (simple) or larger (complex) than 80 (see binary mask in Fig. 4). The error bars show the 16th and 84th percentiles of each distribution.
Current usage metrics show cumulative count of Article Views (full-text article views including HTML views, PDF and ePub downloads, according to the available data) and Abstracts Views on Vision4Press platform.
Data correspond to usage on the plateform after 2015. The current usage metrics is available 48-96 hours after online publication and is updated daily on week days.
Initial download of the metrics may take a while.