Fig. 6.
Download original image
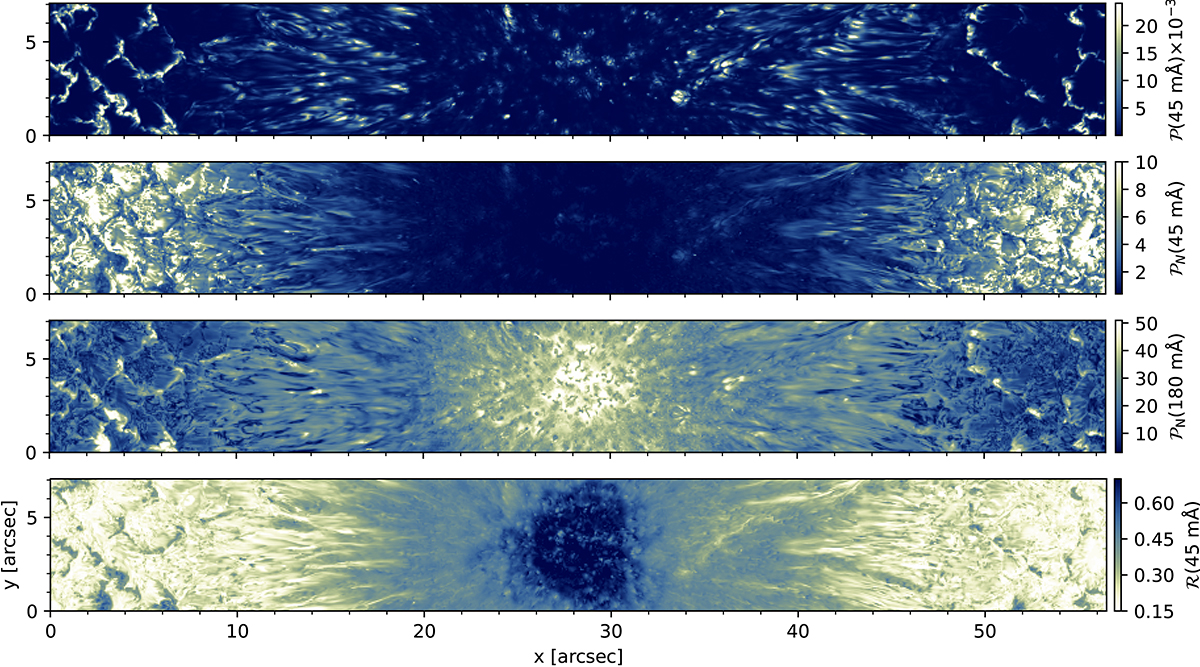
Summary of the wavelet analysis of the Stokes V profiles. The first panel shows the power contained in the wavelet decomposition at scales of 45 mÅ. The second and third panels show the power contained in the normalized spectra at scales of 45 and 180 mÅ, respectively. The fourth panel shows the ratio of the power before and after the degradation at a scale of 45 mÅ.
Current usage metrics show cumulative count of Article Views (full-text article views including HTML views, PDF and ePub downloads, according to the available data) and Abstracts Views on Vision4Press platform.
Data correspond to usage on the plateform after 2015. The current usage metrics is available 48-96 hours after online publication and is updated daily on week days.
Initial download of the metrics may take a while.