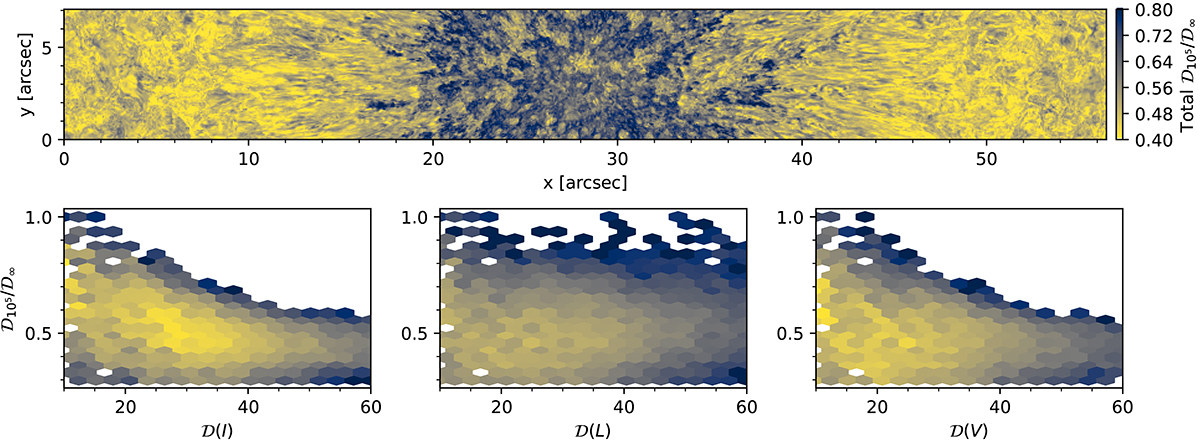
Fig. 5.
Download original image
Difference in the dimensionality of the original and degraded spectra emerging from the simulation. Upper panel: Ratio of the dimensionality calculated from the original spectra emerged from the simulation and after degrading it to a spectral resolution of R = 105 (smaller values are regions where the degraded spectra are more affected). Bottom row: 2D histograms of the ratio of the dimensionality for each Stokes parameter.
Current usage metrics show cumulative count of Article Views (full-text article views including HTML views, PDF and ePub downloads, according to the available data) and Abstracts Views on Vision4Press platform.
Data correspond to usage on the plateform after 2015. The current usage metrics is available 48-96 hours after online publication and is updated daily on week days.
Initial download of the metrics may take a while.