Fig. 2.
Download original image
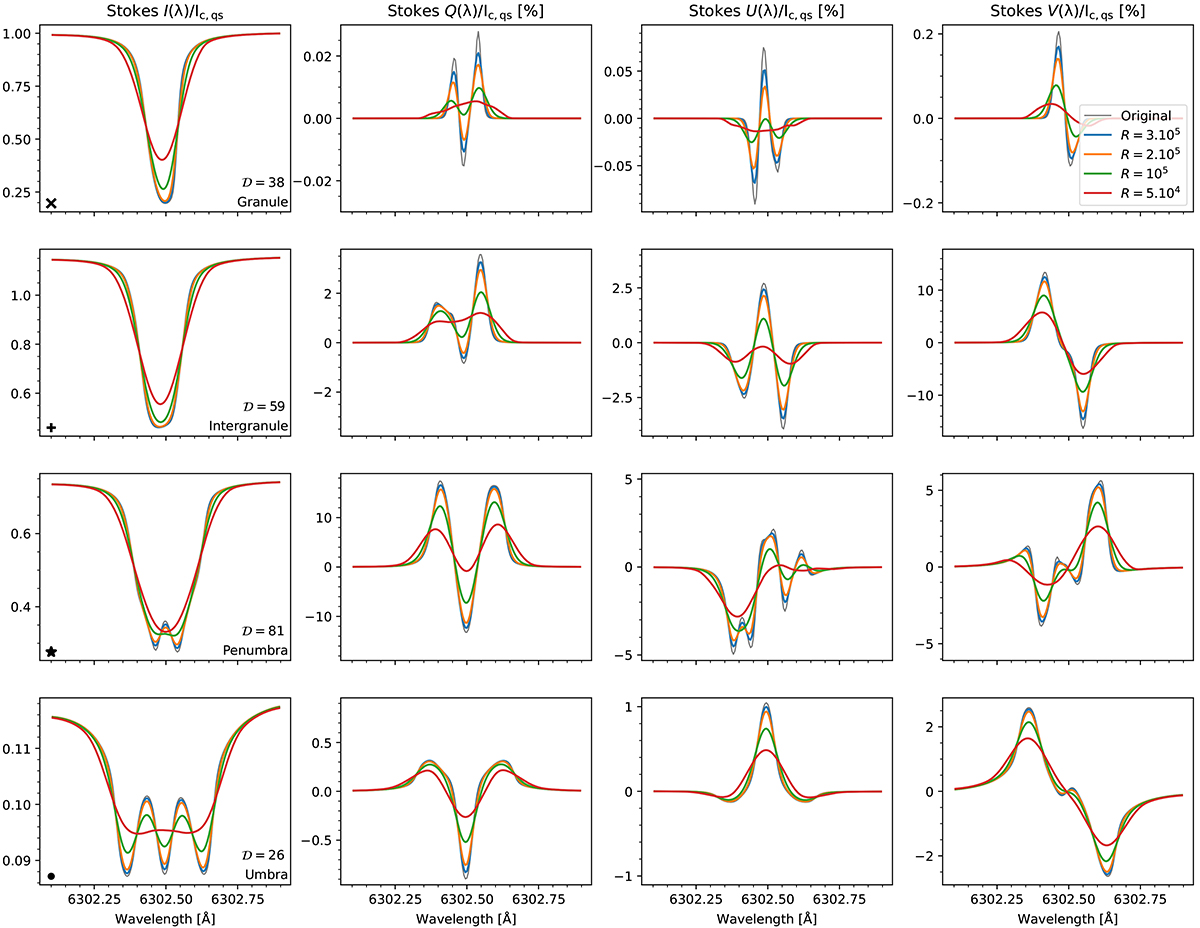
Stokes spectra of example pixels from the simulation, under different spectral resolutions. Only one of the two Fe I lines is shown, for better visibility. The location of each pixel is indicated in Fig. 1 with the same symbols indicated in the lower left corner of each Stokes I panel, together with the total dimensionality of that spectrum, calculated for the non-degraded case.
Current usage metrics show cumulative count of Article Views (full-text article views including HTML views, PDF and ePub downloads, according to the available data) and Abstracts Views on Vision4Press platform.
Data correspond to usage on the plateform after 2015. The current usage metrics is available 48-96 hours after online publication and is updated daily on week days.
Initial download of the metrics may take a while.