Fig. 13.
Download original image
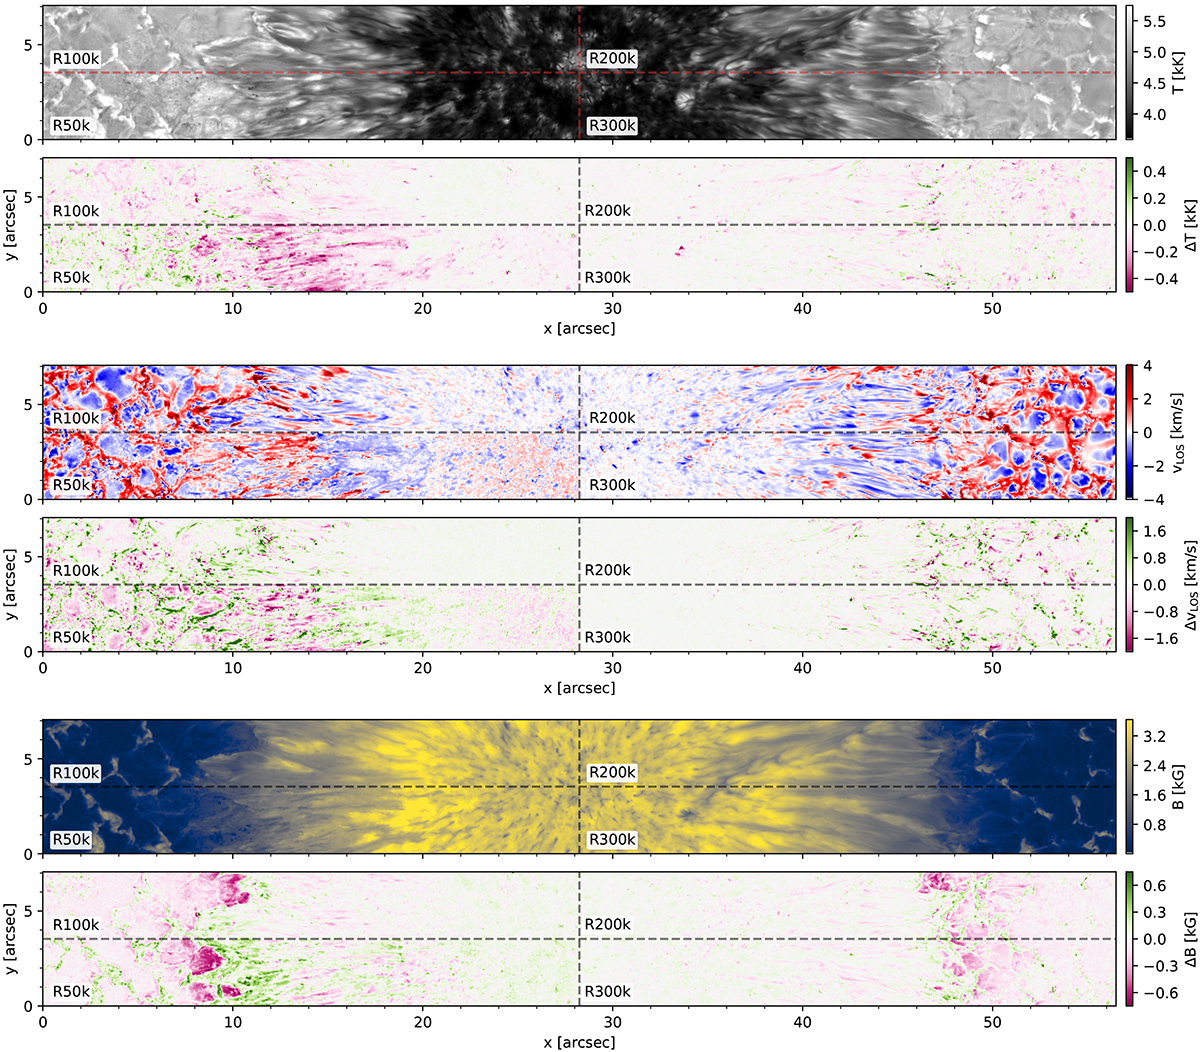
Overview of the inferred physical parameters and the difference between the simulation and inversion at log τ500 = −1. The results for different spectral resolutions are shown in every corner of each map. From top to bottom: temperature, line-of-sight velocity, and magnetic field strength. A positive difference implies underestimation and negative overestimation of the given physical parameter.
Current usage metrics show cumulative count of Article Views (full-text article views including HTML views, PDF and ePub downloads, according to the available data) and Abstracts Views on Vision4Press platform.
Data correspond to usage on the plateform after 2015. The current usage metrics is available 48-96 hours after online publication and is updated daily on week days.
Initial download of the metrics may take a while.