Fig. 1.
Download original image
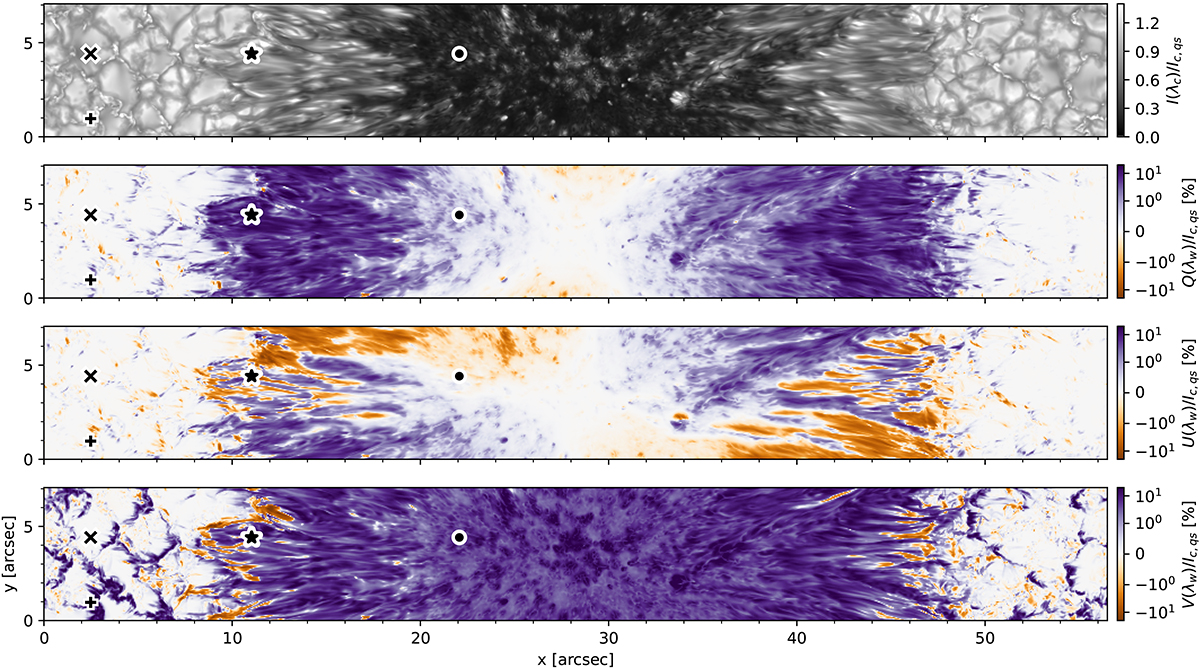
Maps of synthetic intensity and polarization calculated from a snapshot of the MURaM simulation of a sunspot. The upper panel shows the continuum intensity, and the rest display the Stokes Q, U, and V signals at λw = 6301.4 Å, close to the core of the bluer spectral line. All the panels are normalized to the average quiet Sun continuum. The polarization signals are shown on a logarithmic scale for better visualization. Four symbols mark the location of the profiles shown in Fig. 2.
Current usage metrics show cumulative count of Article Views (full-text article views including HTML views, PDF and ePub downloads, according to the available data) and Abstracts Views on Vision4Press platform.
Data correspond to usage on the plateform after 2015. The current usage metrics is available 48-96 hours after online publication and is updated daily on week days.
Initial download of the metrics may take a while.