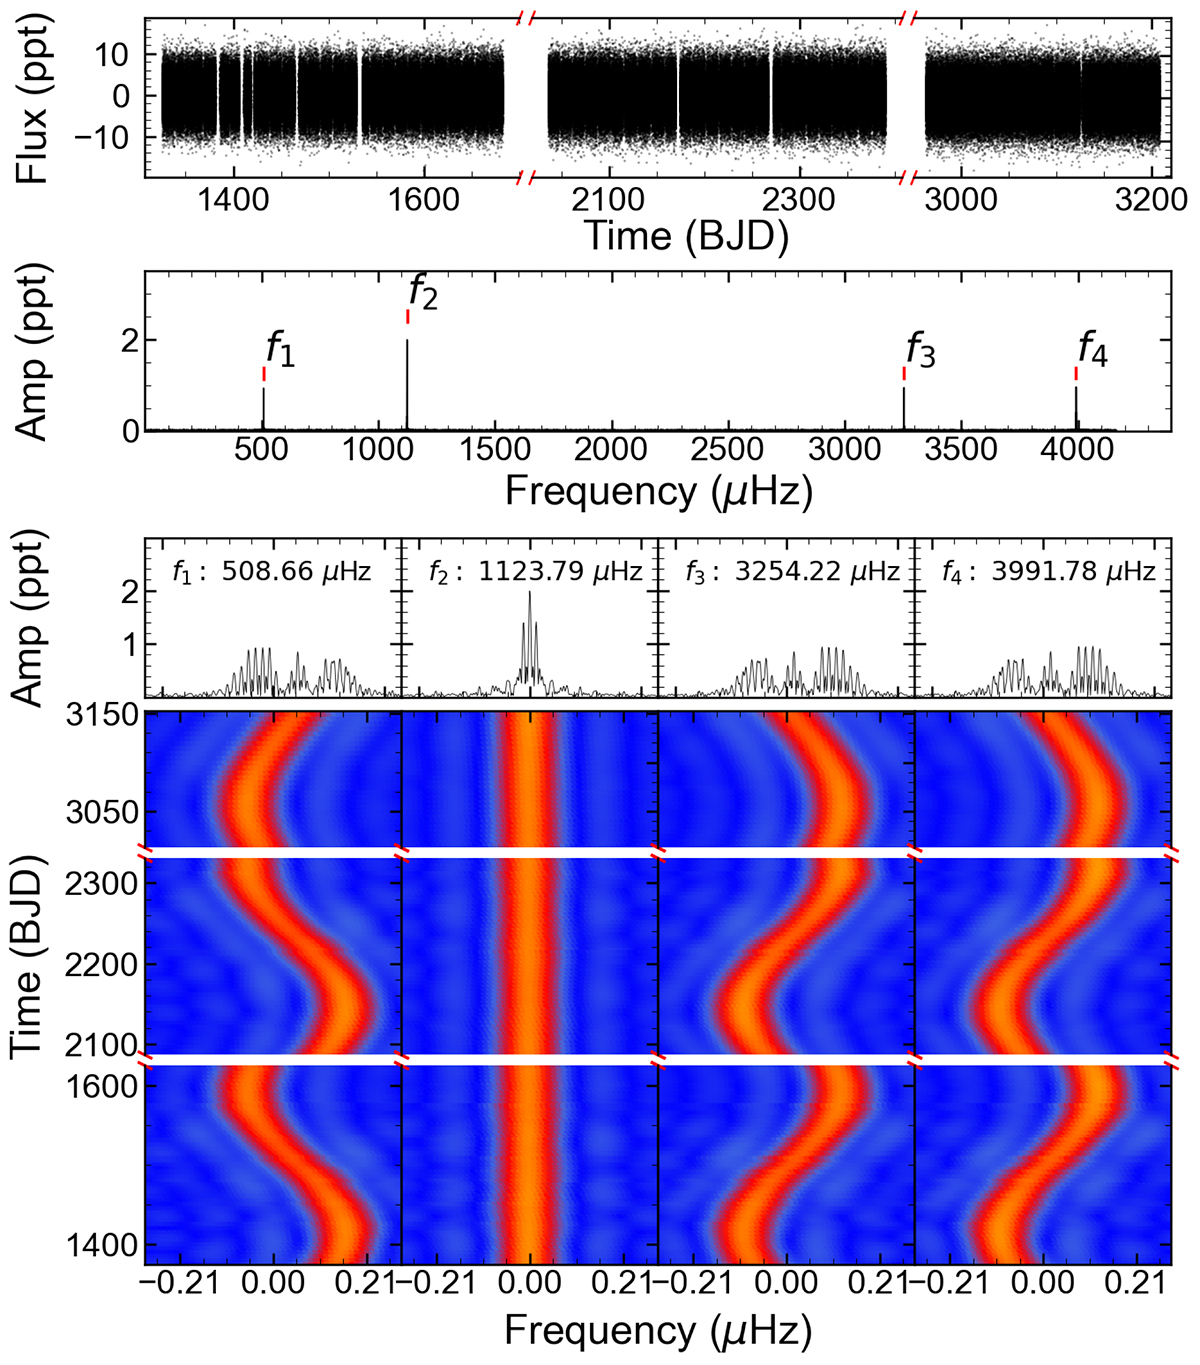
Fig. A.2.
Download original image
Simulation of SNF modulation using the time sampling of TIC 348841203 from TESS data. Top panel: Simulated light curve with a 120-second cadence, displaying amplitude in parts per thousand (ppt) of the mean brightness versus time. Middle panel: LSP displaying amplitude in ppt and frequency in μHz for the simulated light curve. Bottom panel: Sliding LSP of four significant frequencies identified in the LSP.
Current usage metrics show cumulative count of Article Views (full-text article views including HTML views, PDF and ePub downloads, according to the available data) and Abstracts Views on Vision4Press platform.
Data correspond to usage on the plateform after 2015. The current usage metrics is available 48-96 hours after online publication and is updated daily on week days.
Initial download of the metrics may take a while.