Fig. 5.
Download original image
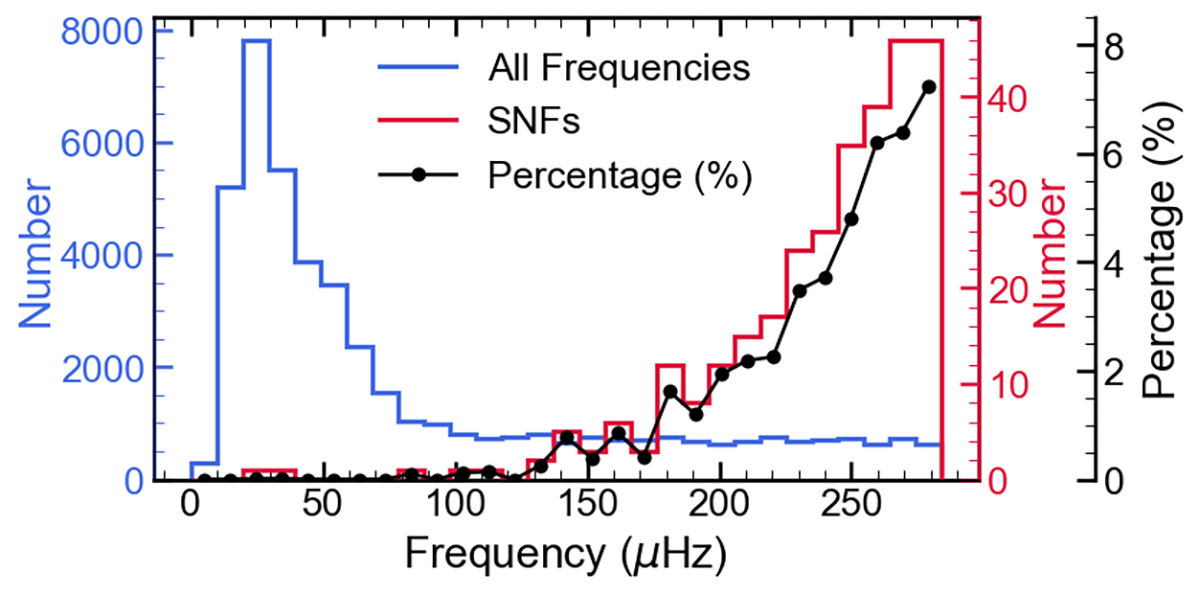
Distribution of 45 607 frequencies detected in 611 γ Dor stars. The three vertical axes correspond to color-coded data. The blue line represents the distribution of all detected frequencies in the 611 γ Dor stars, while the red lines show the distribution of 304 SNFs. The black dots indicate the percentage of SNFs relative to all detected frequencies.
Current usage metrics show cumulative count of Article Views (full-text article views including HTML views, PDF and ePub downloads, according to the available data) and Abstracts Views on Vision4Press platform.
Data correspond to usage on the plateform after 2015. The current usage metrics is available 48-96 hours after online publication and is updated daily on week days.
Initial download of the metrics may take a while.