Fig. 4.
Download original image
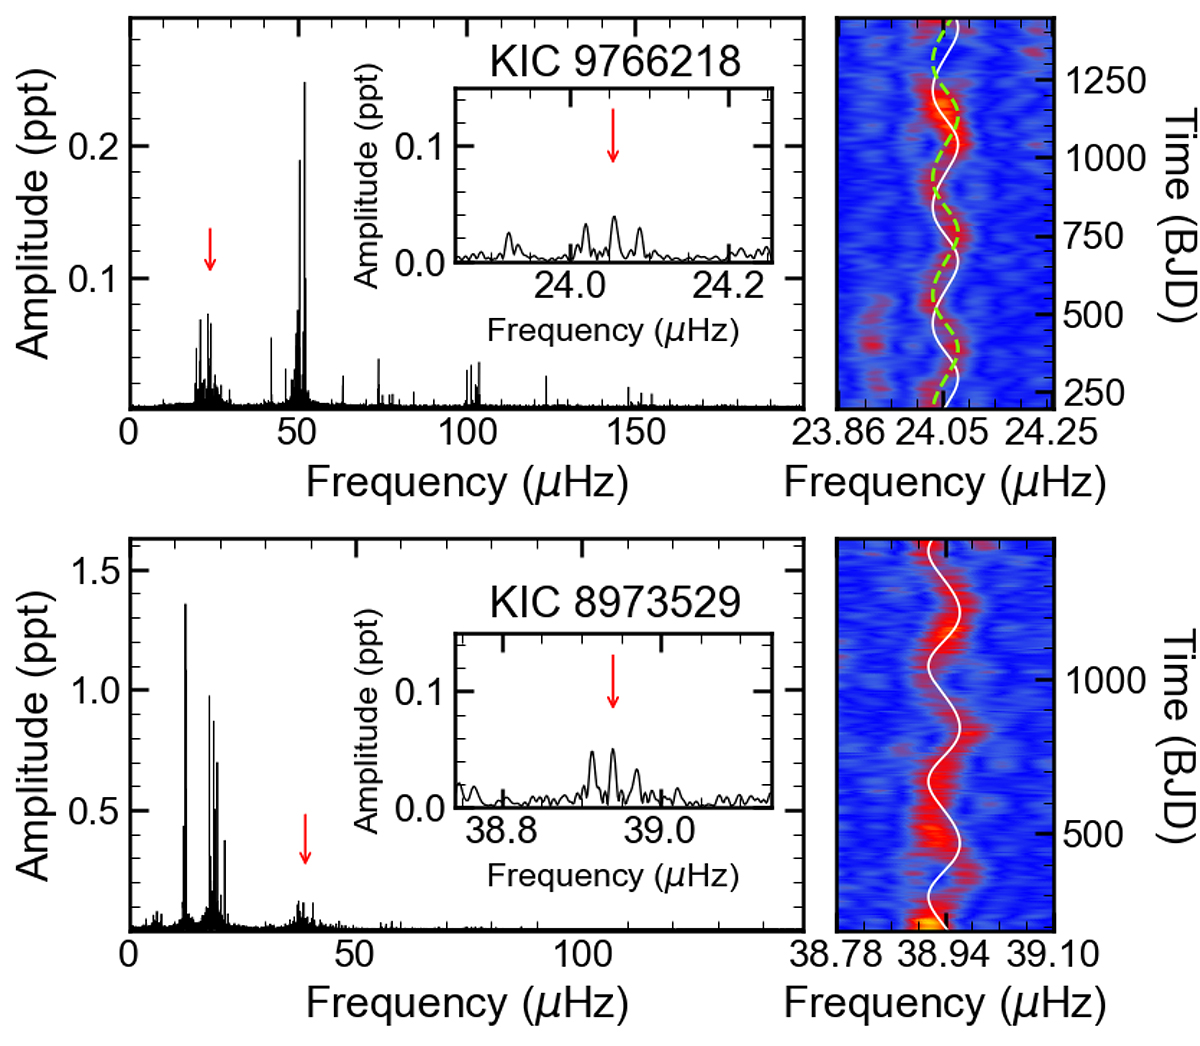
Two high potential cases of SNFs in low frequency range for γ Dor stars. Left panels: LSP in the range where the majority of frequencies are detected. A close-up view of the SNF is zoomed inside. The red vertical arrow locates the SNF. Right panels: Sliding LSP, centered on the SNF, displays a periodic pattern of frequency modulation, which is compared with the theoretical variation of the SNF (solid curve) and a phase (π/2) shifted result (dashed curve).
Current usage metrics show cumulative count of Article Views (full-text article views including HTML views, PDF and ePub downloads, according to the available data) and Abstracts Views on Vision4Press platform.
Data correspond to usage on the plateform after 2015. The current usage metrics is available 48-96 hours after online publication and is updated daily on week days.
Initial download of the metrics may take a while.