Fig. 3.
Download original image
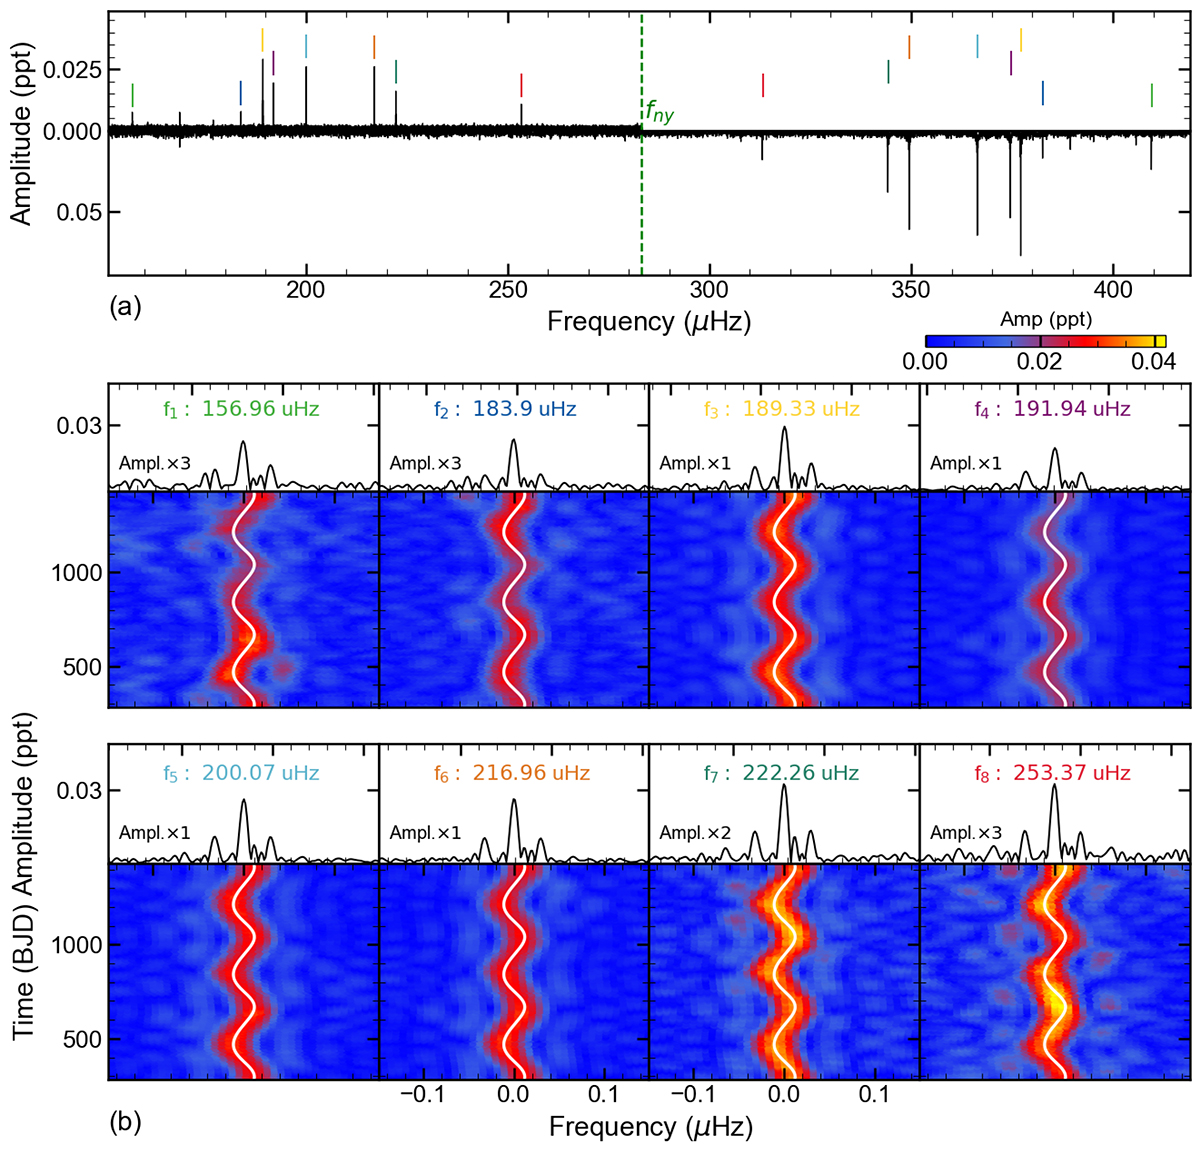
LSP of the majority of detected frequencies and the sliding LSP of eight identified SNFs in KIC 9533489. (a) LSP of the majority of detected frequencies observed in both short- and long-cadence photometry. The vertical segments indicate the positions of the eight SNFs detected in long-cadence photometry, which have been confirmed through SC photometry. (b) Detailed view of the eight SNFs, where each panel displays both the LSP profile and the corresponding sliding LSP. Note: LSPs multiply a factor to improve their visibility by their relative amplitude. The solid curves represent the numerical predictions of SNF modulation, shown in comparison with the observational data.
Current usage metrics show cumulative count of Article Views (full-text article views including HTML views, PDF and ePub downloads, according to the available data) and Abstracts Views on Vision4Press platform.
Data correspond to usage on the plateform after 2015. The current usage metrics is available 48-96 hours after online publication and is updated daily on week days.
Initial download of the metrics may take a while.