Fig. 2.
Download original image
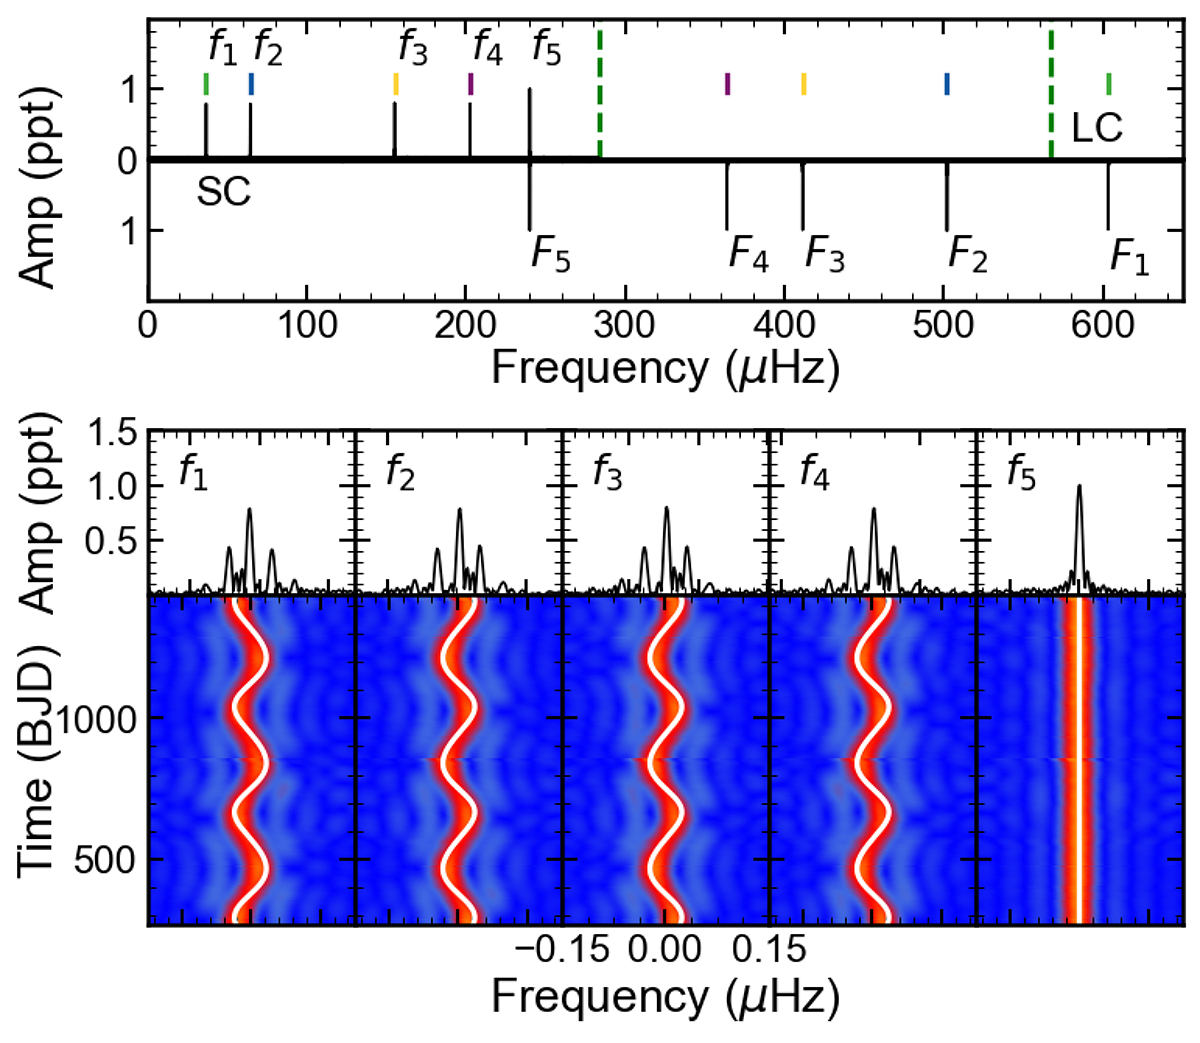
LSP of the simulated photometry. Top panel: General view of the LSP, showing the frequencies injected into the simulated long- (upper) and short-cadence (lower) photometry, respectively. Middle panel: LSPs for the five detected frequencies. Bottom panel: Sliding LSP of the five detected frequencies corresponding to these five frequencies, as depicted in the middle panel.
Current usage metrics show cumulative count of Article Views (full-text article views including HTML views, PDF and ePub downloads, according to the available data) and Abstracts Views on Vision4Press platform.
Data correspond to usage on the plateform after 2015. The current usage metrics is available 48-96 hours after online publication and is updated daily on week days.
Initial download of the metrics may take a while.