Open Access
Fig. 1.
Download original image
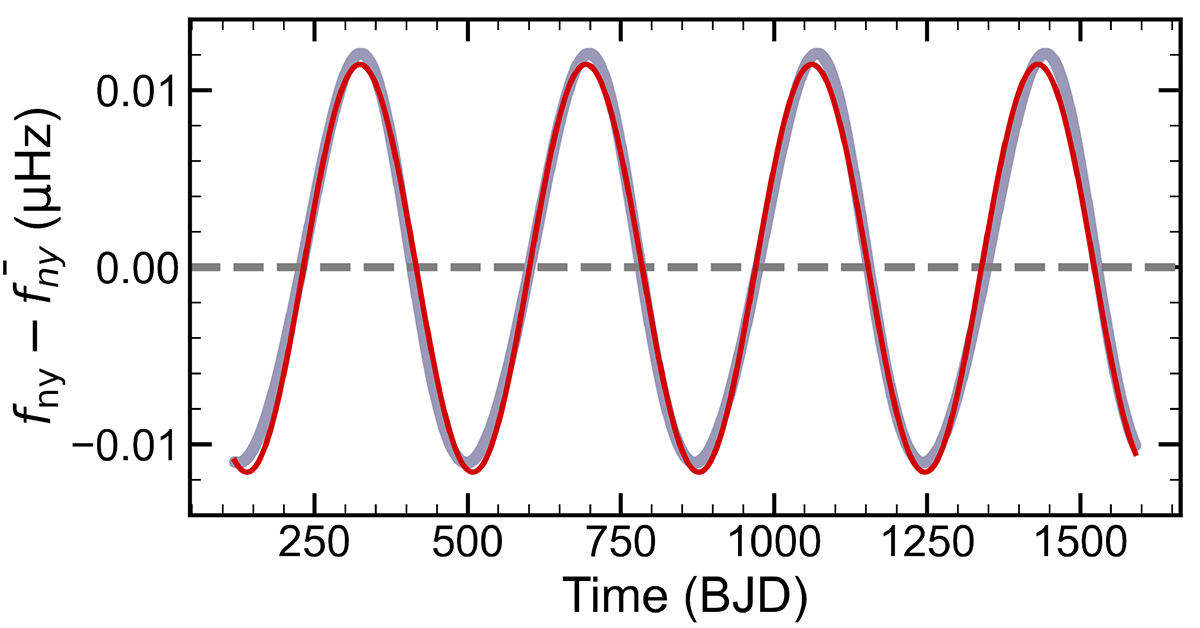
Modulating pattern of fny derived from numerical calculation using Kepler long-cadence photometry. The gray dots (too dense) represent the numerical results, while the red solid curve denotes the fitting results. The dashed horizontal line indicates the mean value of fny.
Current usage metrics show cumulative count of Article Views (full-text article views including HTML views, PDF and ePub downloads, according to the available data) and Abstracts Views on Vision4Press platform.
Data correspond to usage on the plateform after 2015. The current usage metrics is available 48-96 hours after online publication and is updated daily on week days.
Initial download of the metrics may take a while.