Fig. 8
Download original image
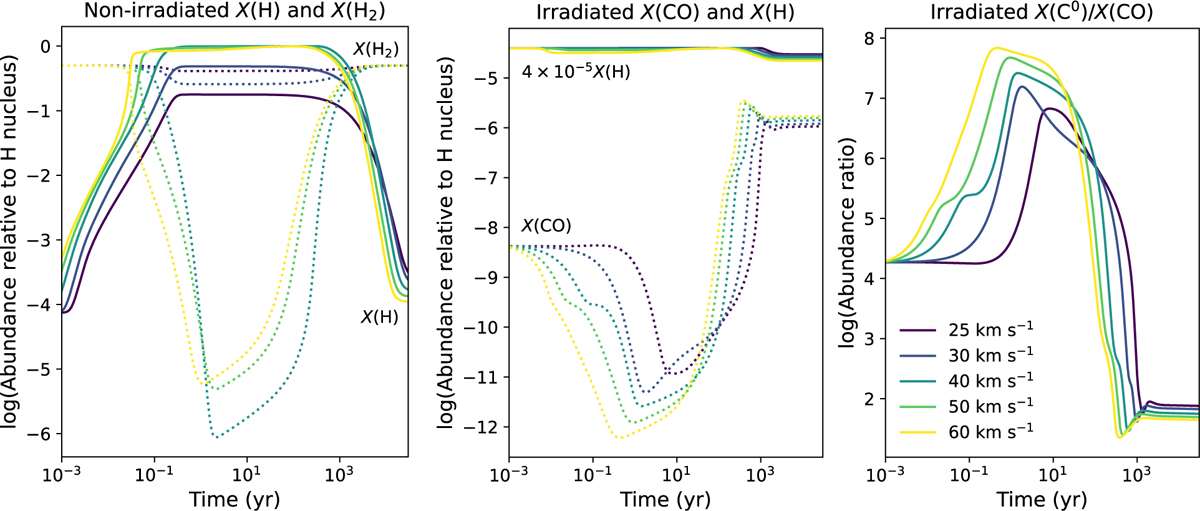
Auxiliary results of the nonirradiated (left panel) and irradiated (middle and right panel) shock models with a preshock density of nH = 2 × 103 cm−3. The lines with different colors show the results of different shock velocities, as shown in the labels of the right panel. Left panel: evolution of the abundances (denoted by X) of H (solid lines) and H2 (dotted lines) relative to the total H nucleus in the nonirradiated models. Middle panel: evolution of the abundances of H (solid lines, multiplied by a factor of 4 × 10⁻⁵) and CO (dotted lines) relative to the total H nucleus in the irradiated models. Right panel: evolution of the abundance ratio N(C0)/N(CO) in the irradiated models.
Current usage metrics show cumulative count of Article Views (full-text article views including HTML views, PDF and ePub downloads, according to the available data) and Abstracts Views on Vision4Press platform.
Data correspond to usage on the plateform after 2015. The current usage metrics is available 48-96 hours after online publication and is updated daily on week days.
Initial download of the metrics may take a while.