Open Access
Fig. 6
Download original image
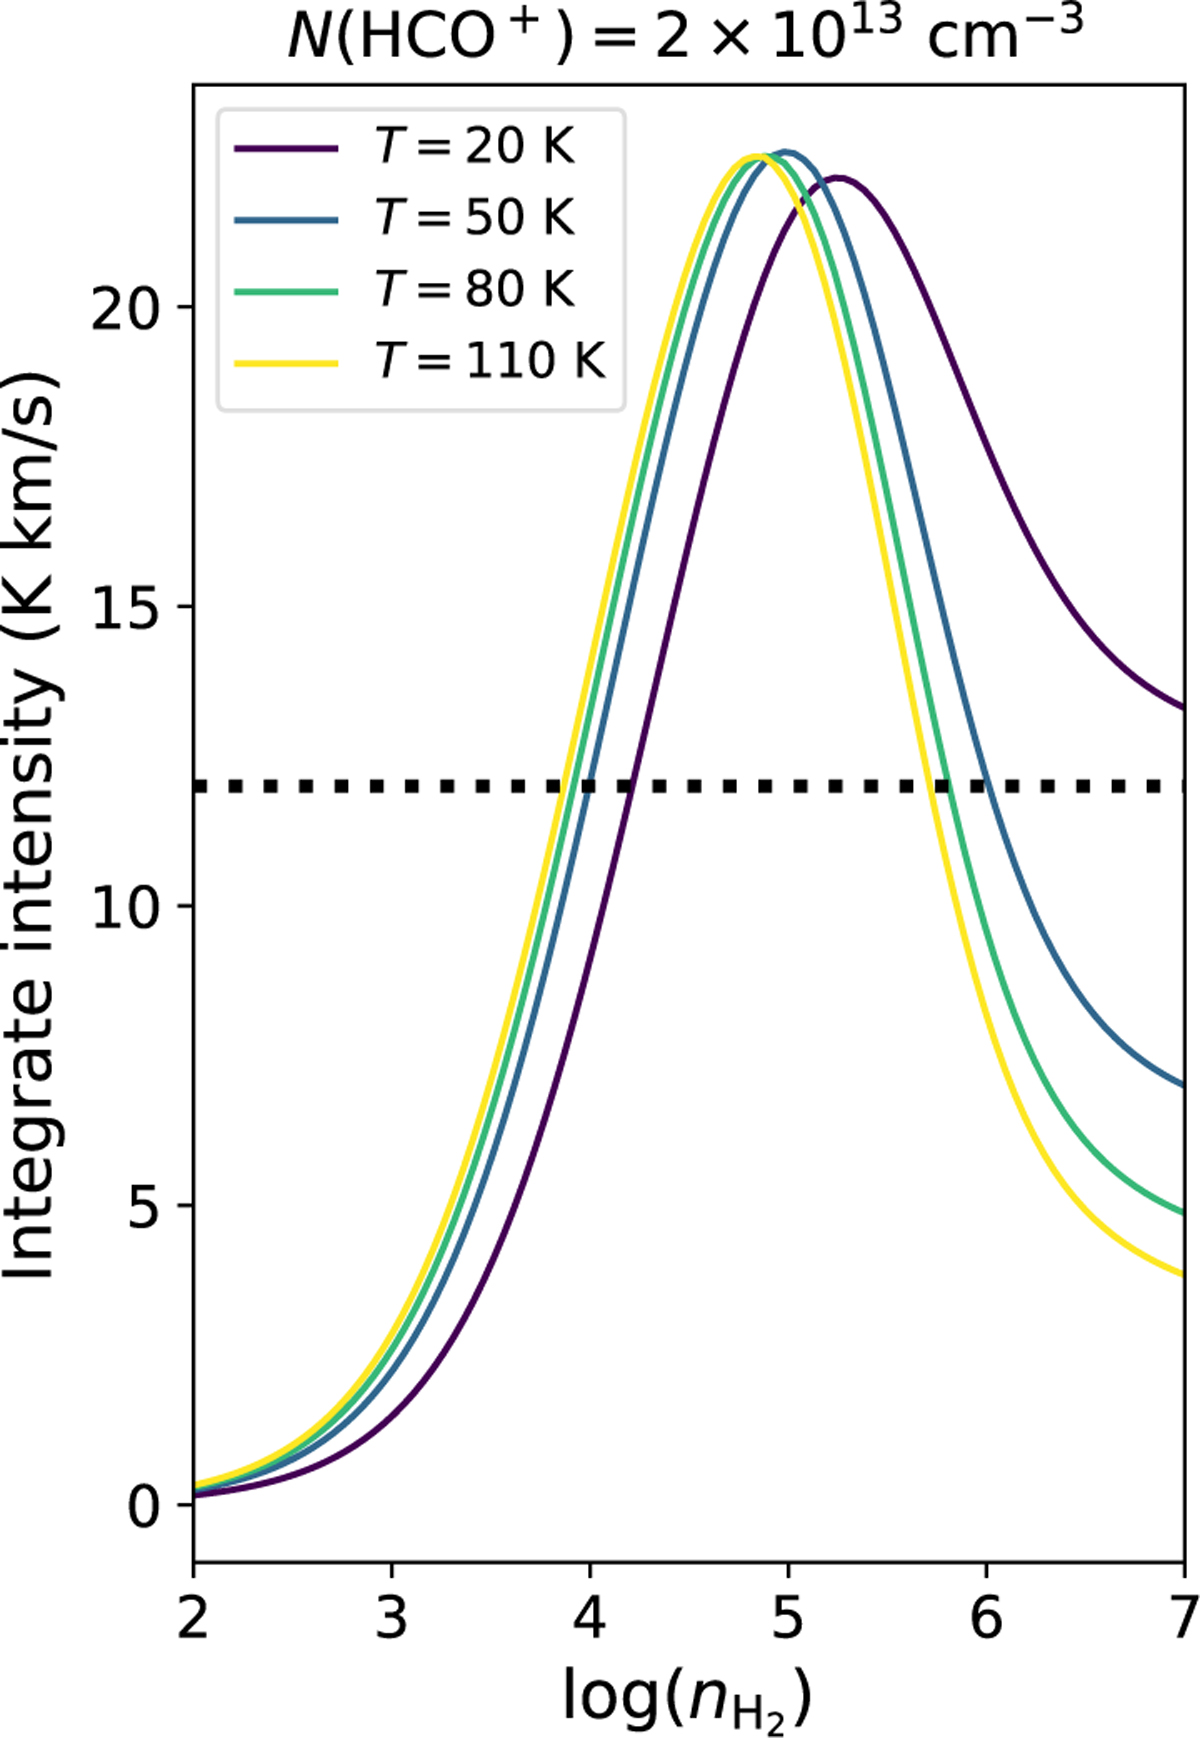
Predicted integrated intensity of HCO+ J = 1–0 line as a function of nH2. The lines with different colors show the models with different gas temperatures. The dotted black line in the right panel shows an integrated intensity of 12 K km s−1.
Current usage metrics show cumulative count of Article Views (full-text article views including HTML views, PDF and ePub downloads, according to the available data) and Abstracts Views on Vision4Press platform.
Data correspond to usage on the plateform after 2015. The current usage metrics is available 48-96 hours after online publication and is updated daily on week days.
Initial download of the metrics may take a while.