Open Access
Fig. 2
Download original image
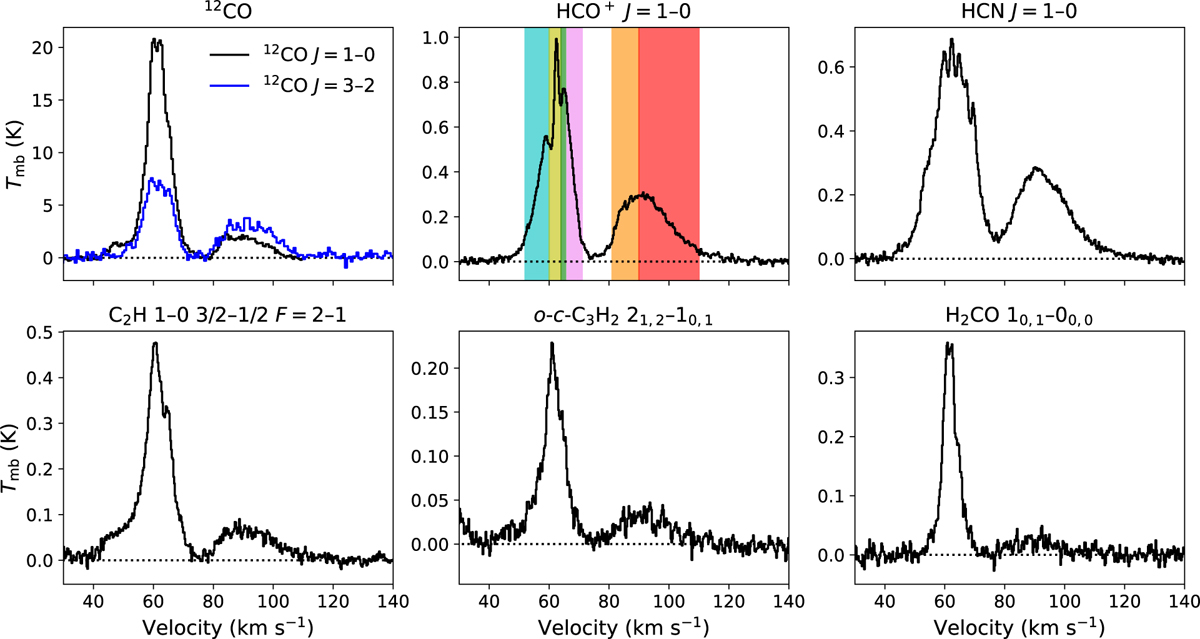
Spectra of the molecular transitions with emission detected in the velocity range +80− +110 km s−1 averaged across the entire mapped region. The velocity integration intervals for the six velocity components are shown by colored rectangles in the spectrum of HCO+.
Current usage metrics show cumulative count of Article Views (full-text article views including HTML views, PDF and ePub downloads, according to the available data) and Abstracts Views on Vision4Press platform.
Data correspond to usage on the plateform after 2015. The current usage metrics is available 48-96 hours after online publication and is updated daily on week days.
Initial download of the metrics may take a while.