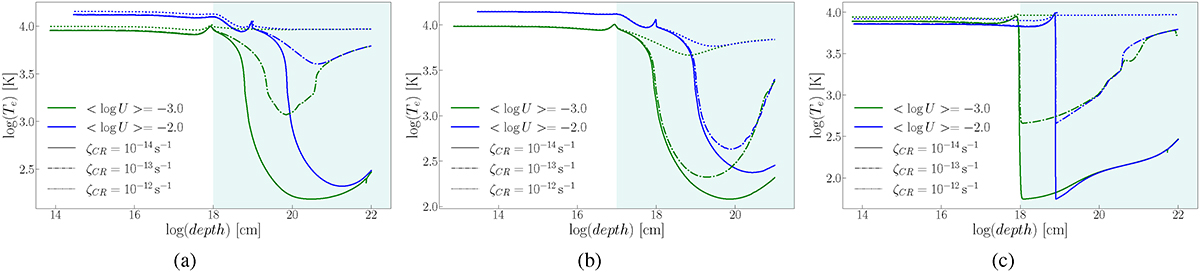
Fig. 8.
Download original image
Temperature vs. depth in the simulated cloud for AGN and SF models, for a given initial density (see subcaption), three ζCR values, 10−14 s−1 (solid line), 10−13 s−1 (dash-dotted), and 10−12 s−1 (dotted), and two log U values of −3.0 (green) and −2.0 (blue). The teal-shaded area indicates the approximate region where CR heating becomes dominant. (a) Temperature, AGN, nH = 100 cm−3. (b) Temperature, AGN, nH = 103 cm−3. (c) Temperature, SF, nH = 100 cm−3.
Current usage metrics show cumulative count of Article Views (full-text article views including HTML views, PDF and ePub downloads, according to the available data) and Abstracts Views on Vision4Press platform.
Data correspond to usage on the plateform after 2015. The current usage metrics is available 48-96 hours after online publication and is updated daily on week days.
Initial download of the metrics may take a while.