Fig. B.3.
Download original image
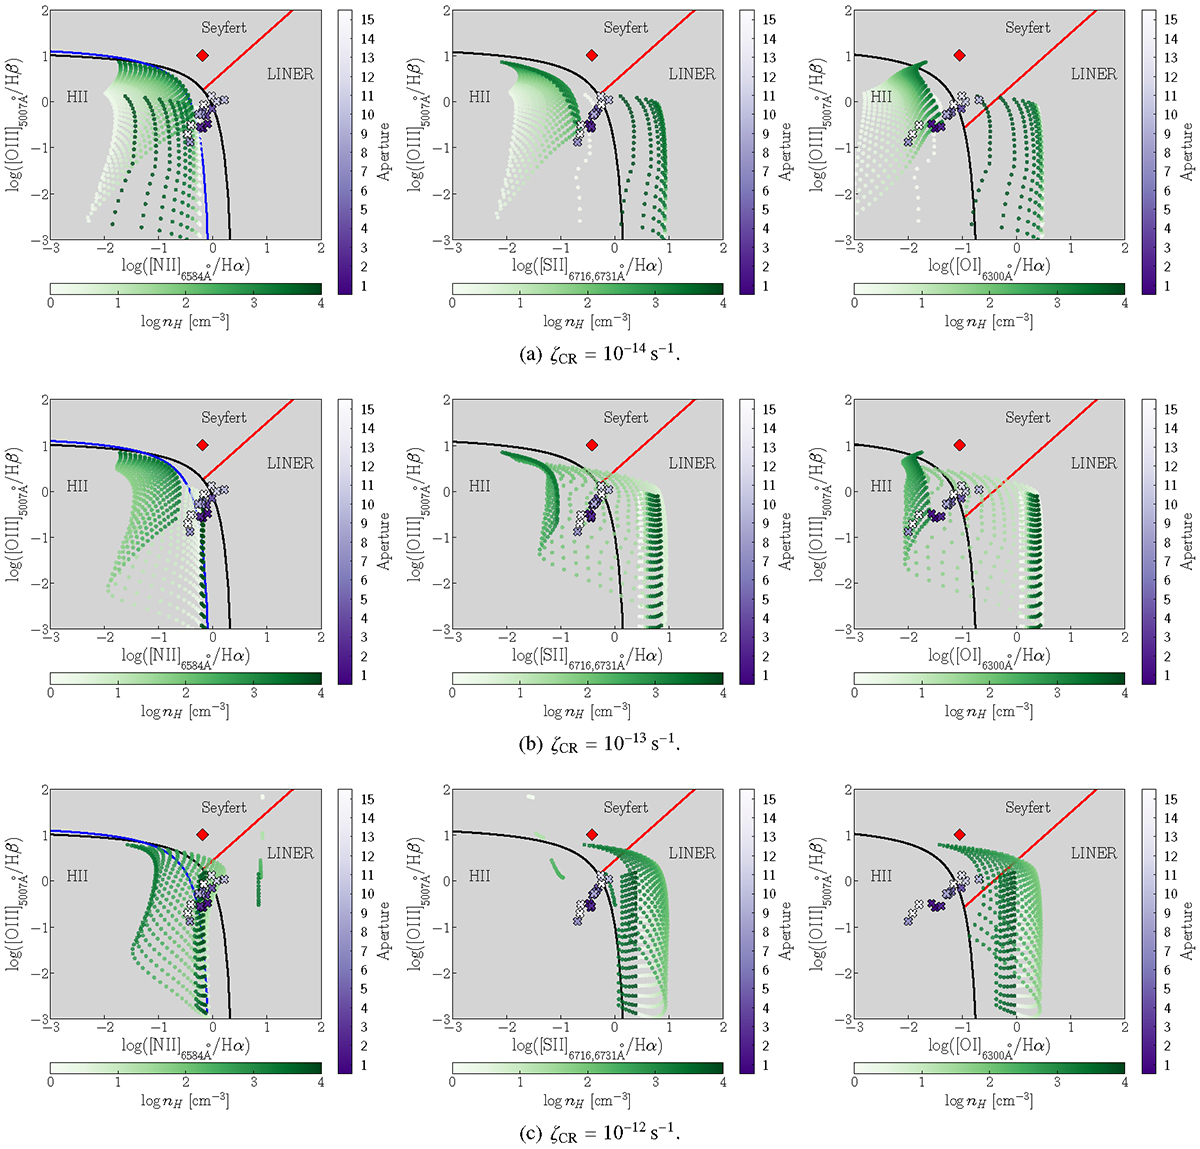
BPT diagrams with the SF photoionization models compared with the observed line ratios from the selected apertures in NGC 253 (Fig. 1c). The BPT diagrams for [N II], [S II], and [O I] are shown on the left, middle, and right, respectively. The different shades of purple going from deep purple to pale lilac/white represent the ascending distance, as also noted with numbers, with "1" being the most central aperture. Also from white to deep green, the different shades of green represent the range of SF models’ densities 1 ≤ nH ≤ 104 cm−3. All the models shown have solar abundances. The red diamonds represent the measured line ratios for the photoionization-dominated Seyfert 2 nucleus in NGC 1320. The Kewley, Kauffmann, and Schawinski lines correspond to the black, blue, and red solid lines, respectively.
Current usage metrics show cumulative count of Article Views (full-text article views including HTML views, PDF and ePub downloads, according to the available data) and Abstracts Views on Vision4Press platform.
Data correspond to usage on the plateform after 2015. The current usage metrics is available 48-96 hours after online publication and is updated daily on week days.
Initial download of the metrics may take a while.