Fig. 13.
Download original image
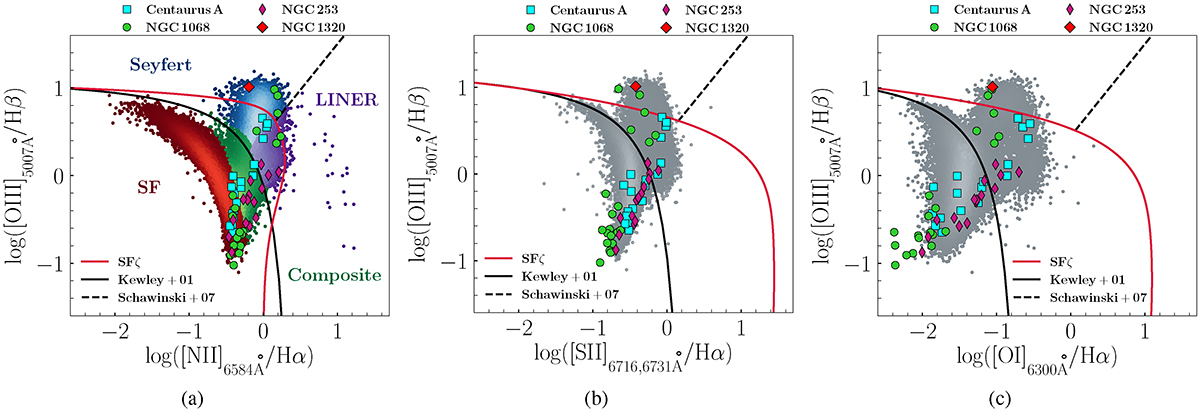
BPT diagrams depicting [N II]/Hα, [S II]/Hα, and [O I]/Hα ratios. Our proposed SFζ maximum starburst line is illustrated in red color, compared with the full observational dataset. Observations from Centaurus A, NGC 1068, NGC 253, and NGC 1320 are marked by cyan squares, green circles, magenta thin diamonds, and a red diamond, respectively. The Kewley and Schawinski lines are indicated with solid and dashed black, respectively, while the SFζ line is depicted by the red-solid line. In the background we show the line ratios measured for nearby galaxies from the Sloan Digital Sky Survey (SDSS) Data Release 7 (Abazajian et al. 2009).
Current usage metrics show cumulative count of Article Views (full-text article views including HTML views, PDF and ePub downloads, according to the available data) and Abstracts Views on Vision4Press platform.
Data correspond to usage on the plateform after 2015. The current usage metrics is available 48-96 hours after online publication and is updated daily on week days.
Initial download of the metrics may take a while.