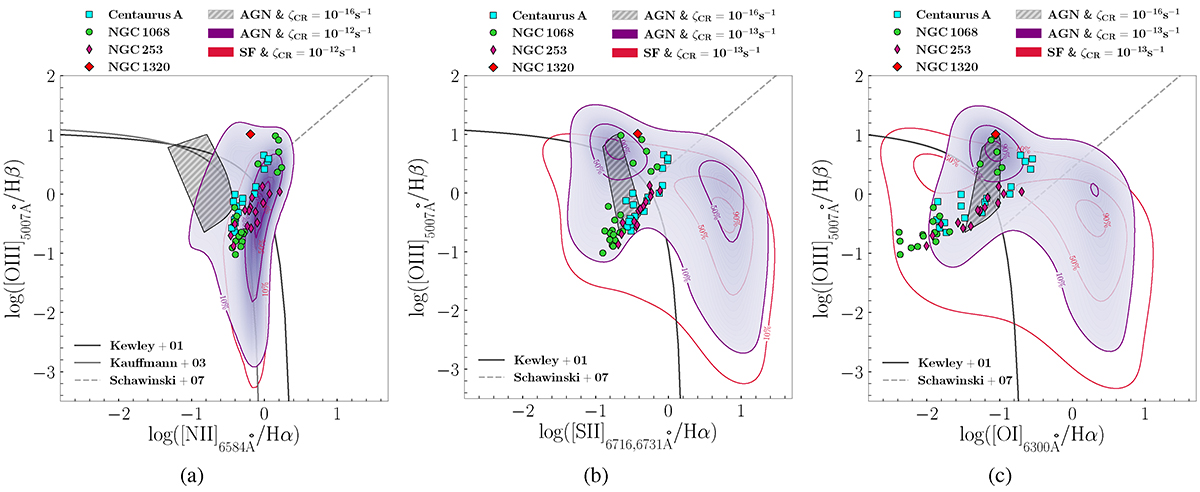
Fig. 12.
Download original image
BPT diagrams depicting the area covered by AGN and SF models with solar abundances for −3.5 ≤ log U ≤ −1.5, shown with purple and red contours, with 1 ≤ log nH ≤ 3.5 and, 1 ≤ log nH ≤ 3 respectively. The solid contour lines map regions containing 10%, 50%, and 90% of the models with ζCR = 10−12 s−1 in the [N II] BPT diagram, and 10−13 s−1 in both the [S II] and the [O I] panels. The gray hatched area stands for AGN models with ζCR = 10−16 s−1, of the order of the average Galactic CR background (Indriolo et al. 2007). Cyan squares represent line ratios measured for the regions selected in Centaurus A, green circles for regions in NGC 1068, magenta thin diamonds for regions in NGC 253, and the red diamond correspond to the photoionization-dominated Seyfert 2 nucleus in NGC 1320. The Kewley, Kauffmann, and Schawinski lines correspond to the solid dark gray, the solid medium gray, and dashed light gray lines, respectively.
Current usage metrics show cumulative count of Article Views (full-text article views including HTML views, PDF and ePub downloads, according to the available data) and Abstracts Views on Vision4Press platform.
Data correspond to usage on the plateform after 2015. The current usage metrics is available 48-96 hours after online publication and is updated daily on week days.
Initial download of the metrics may take a while.