Fig. 11.
Download original image
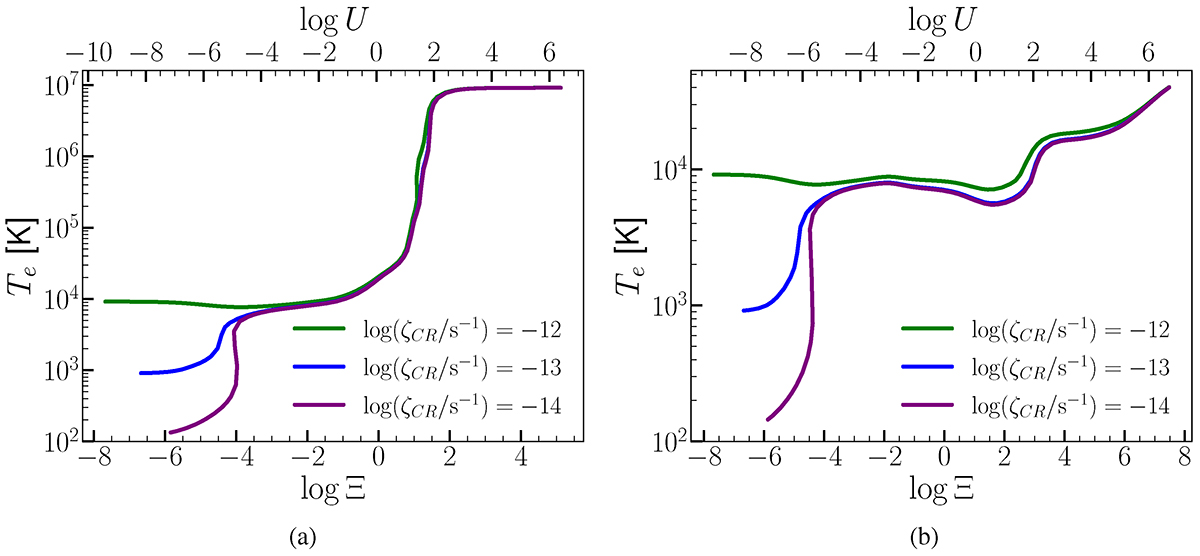
Thermal stability plots, depicting electron temperature as a function of the ionization parameter Ξ for different values CR ionization rate, 10−14 s−1, 10−13 s−1, 10−12 s−1 illustrated with purple, blue and green lines respectively. The upper x-axis shows the corresponding values for the ionization parameter U. (a) Te in AGN models for nH = 100 cm−3. (b) Te in SF models for nH = 100 cm−3.
Current usage metrics show cumulative count of Article Views (full-text article views including HTML views, PDF and ePub downloads, according to the available data) and Abstracts Views on Vision4Press platform.
Data correspond to usage on the plateform after 2015. The current usage metrics is available 48-96 hours after online publication and is updated daily on week days.
Initial download of the metrics may take a while.