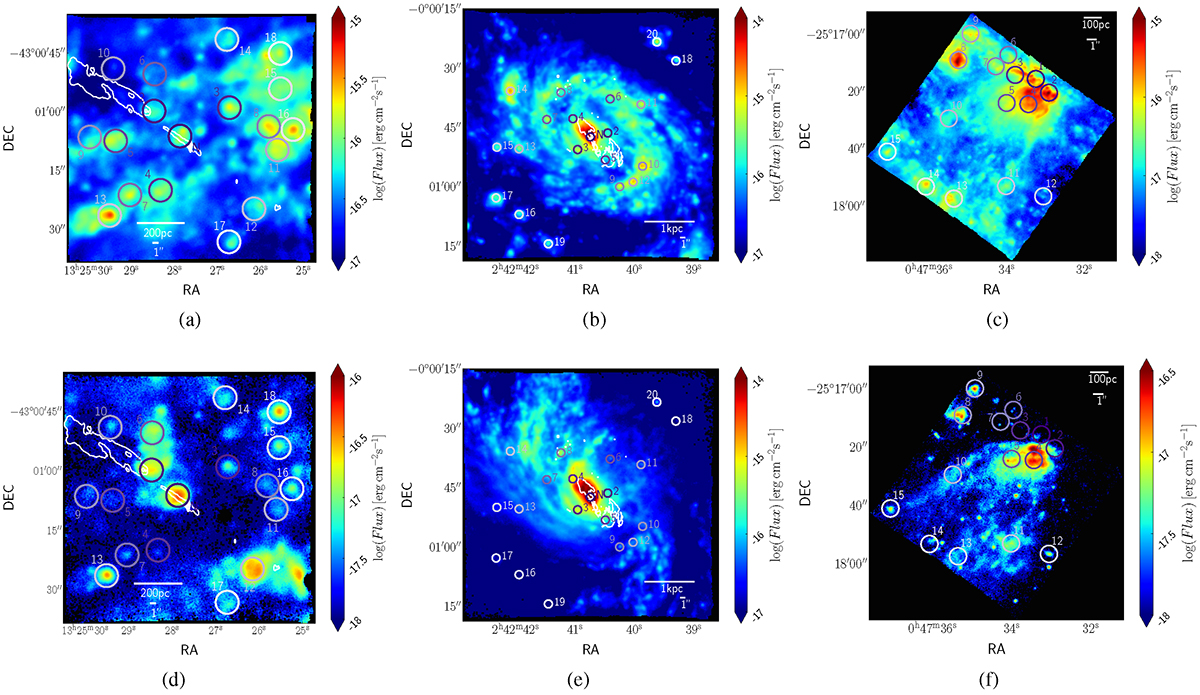
Fig. 1.
Download original image
Apertures chosen to extract spectra with MPDAF. The different shades of purple going from deep purple to pale lilac represent the ascending distance, and are also noted with numbers. The apertures are drawn over Hα and [O III]λ5007 Å, emission with the stellar continuum subtracted. In Centaurus A, the jets are depicted by use of VLA data at 8.4 GHz (Hardcastle et al. 2003; Tingay & Lenc 2009), in white contours at levels 7 × 10⁻⁴ Jy/beam, 10−2 Jy/beam, 0.1 Jy/beam, and 6 Jy/beam. Similarly, for NGC 1068, the jets are illustrated using combined data from e-MERLIN and the VLA at 5 GHz (Gallimore et al. 1996; Muxlow et al. 1996; Mutie et al. 2024), in white contours at levels 10−4 Jy/beam, 5 × 10⁻² Jy/beam, and 10−2 Jy/beam. All radio data were aligned with optical data based on astrometry. (a) Centaurus A, Hα line map. (b) NGC 1068, Hα line map. (c) NGC 253, Hα line map. (d) Centaurus A, [O III]λ5007 Å line map. (e) NGC 1068, [O III]λ5007 Å line map. (f) NGC 253, [O III]λ5007 Å line map.
Current usage metrics show cumulative count of Article Views (full-text article views including HTML views, PDF and ePub downloads, according to the available data) and Abstracts Views on Vision4Press platform.
Data correspond to usage on the plateform after 2015. The current usage metrics is available 48-96 hours after online publication and is updated daily on week days.
Initial download of the metrics may take a while.